2016–2017 Web Salary Survey
Tools, trends, what pays (and what doesn't) for web professionals.
 Butterfly, Caterpillar, Moth, Insects, and Currants; Jan van Kessel II (source: The J. Paul Getty Museum)
THE WEB IS A MAJOR EMPLOYER for computer programmers
and designers. Many people see the web as their big
chance at a career that is both lucrative and fulfilling—witness
the enormous number of companies that offer courses in
various types of web development, and the large numbers of
applicants from whom they can choose their student bodies.
The World Wide Web began as an interlinked system for
sharing hypertext documents amongst a small community
of scientists. Three decades later, the web is everywhere. It’s
your desktop browser, your phone, an app on your tablet, a
ticketing kiosk at the airport, your television, and even in your
car. The web has grown up and it moves incredibly fast.
In its early days, JavaScript was mostly used to glue things
together in the browser. Fifteen years later, things are much
different. JavaScript is one of the most popular and in-demand
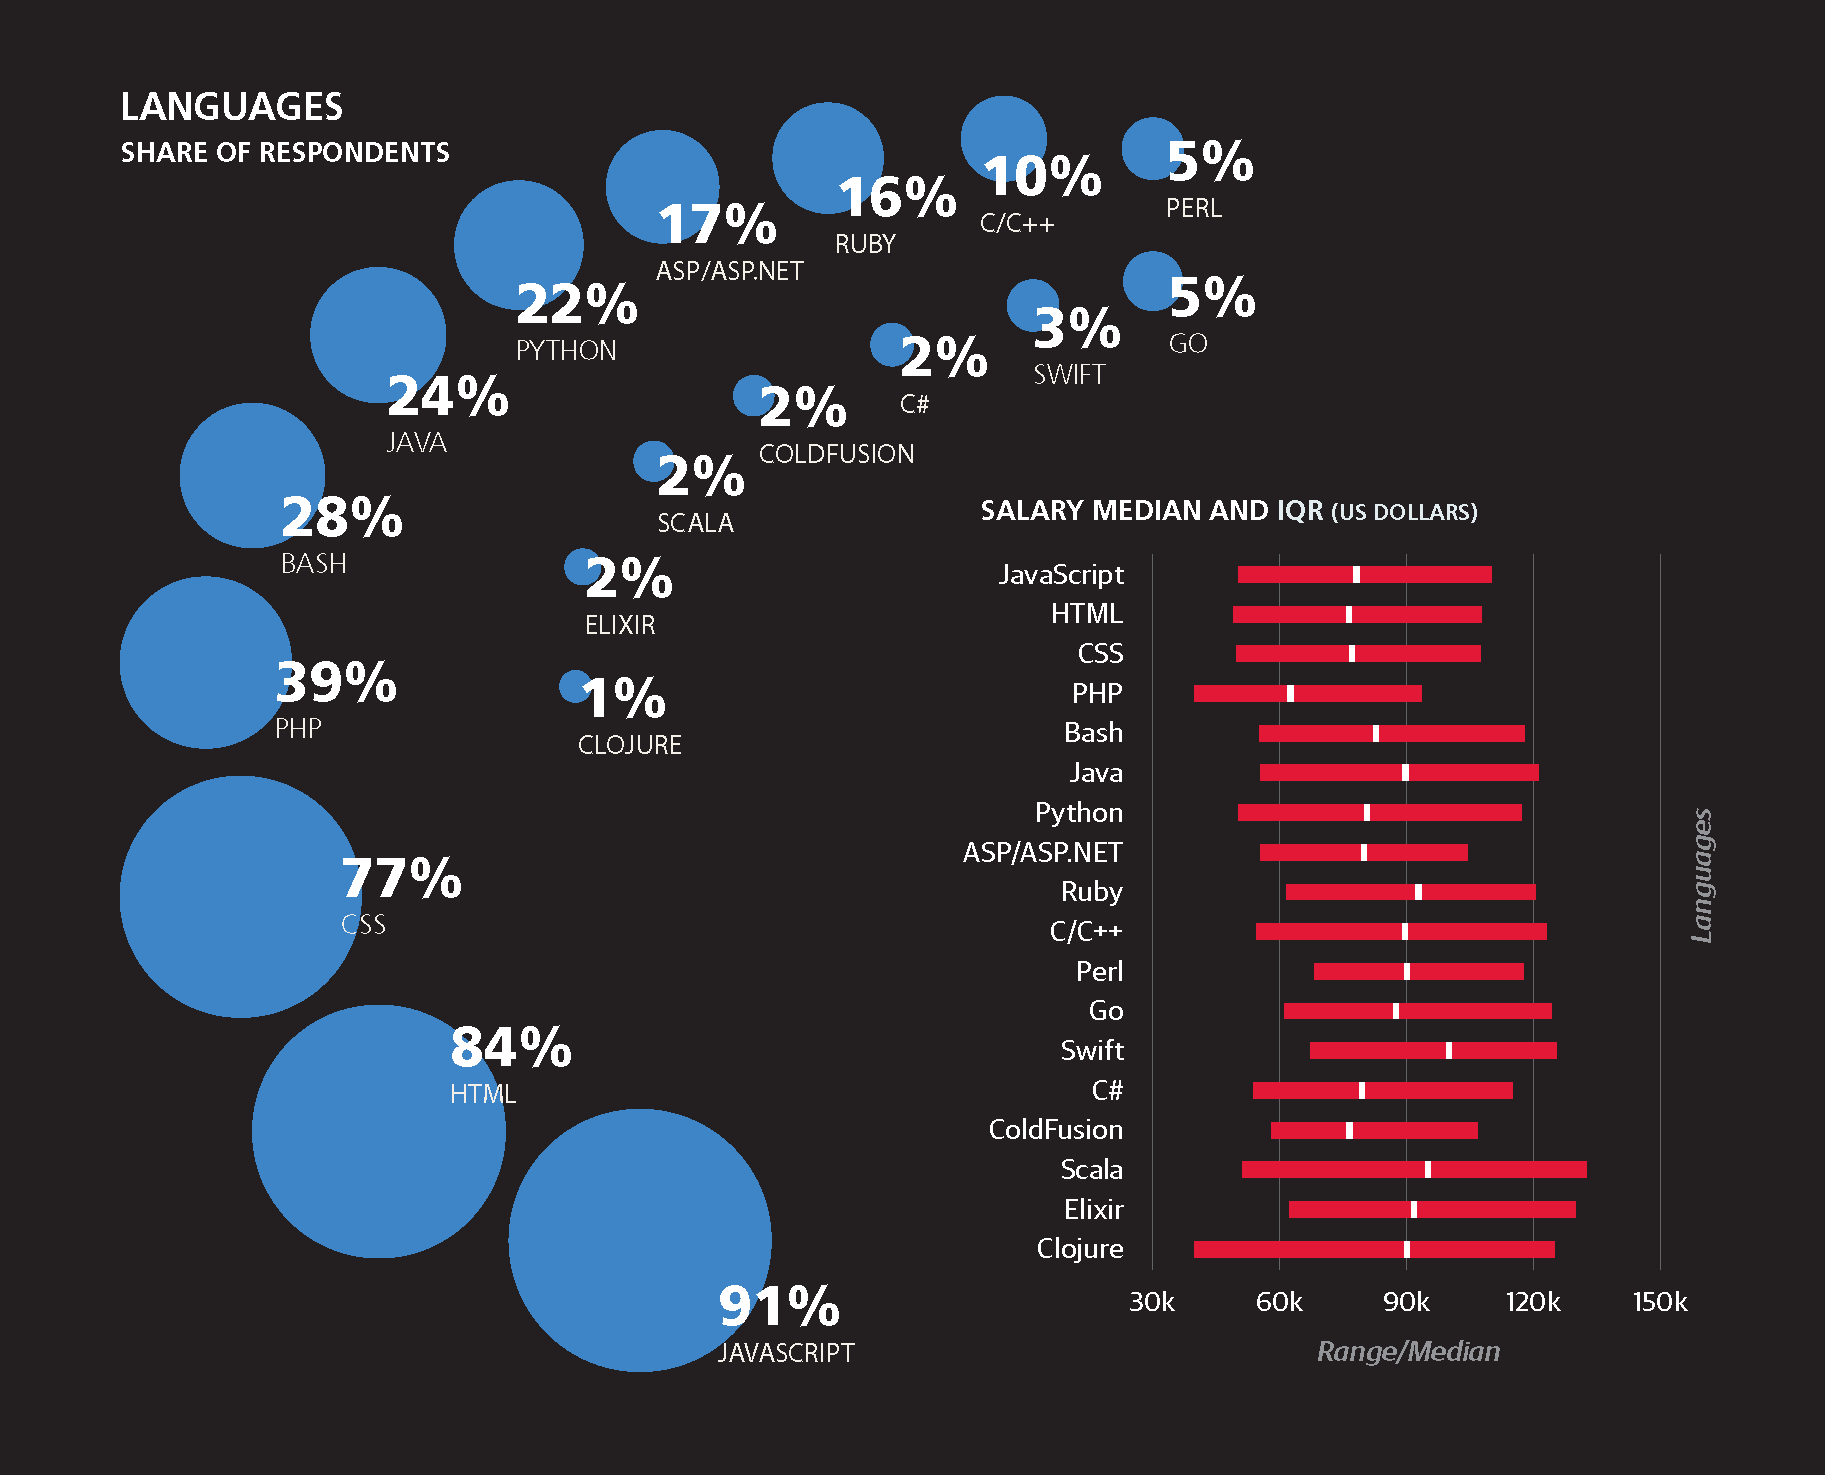
programming languages, and HTML5, CSS, and
other core technologies making up the modern web have
matured with it.
The web also occupies an interesting space in the field of
software development as it proves a welcoming entry point
for beginning programmers and subsequently a space for
advancement and specialization. The speed of change in web
development, in terms of favored tooling, techniques, and
standards, allows for much innovation in a vibrant ecosystem
of developers. It also presents some challenges for those trying
to keep up, or those trying to survey the field, for instance.
So what can you earn as a web developer? How does the
type of job, the language you use, or your geographic location
affect your salary? That’s what this report, based on a
survey of more than 2,000 developers, tries to establish.
For the past few years, O’Reilly Media has conducted worldwide
salary surveys of people working in the computer field.
Following a general survey of all computing positions, we
reached out to those doing web work in order to produce
this report.
In the survey, respondents shared details about themselves,
the companies they work for, and their roles. We asked for
specifics regarding age, number of years in the field, job
description, number of work hours, etc. One of the most
interesting parts of the report, we think, concerns tools,
programming languages, and platforms. These have a major
impact on salary.
Limitations
OF COURSE, OUR METHODS ARE INEXACT, and you
should be aware of several ways in which this report may fail
to reflect reality:
-
The sample size may sometimes be inadequate. Although
2,000 is a large number of people and worth drawing
conclusions from, the conclusions become less reliable as
we break down the respondents into groups that use a
particular tool. -
We had to group people who differ in known ways.
For instance, we sometimes lumped together people
in different countries to get a sample large enough
to be meaningful, and obviously, salaries will vary in
different places. -
The respondents are self-chosen, not a random sample.
They are likely to be people who use O’Reilly Media
products and resources, and might not reflect the field as
a whole. -
Because we depend on what respondents say about
themselves, we have to trust them to be accurate and
objective. Some questions are deliberately subjective—for
instance, we ask respondents to rate their own ability to
negotiate for a higher salary. -
The data behind this report was collected in March and
April of 2016. Technical fields change quickly, and it has
been more than six months since the respondents filled
out their surveys. -
Respondents in the web area vary a great deal in both
responsibilities and skills. There is also a great deal of
churn in the field, and part-timers.
With these caveats in mind, let’s see what our data tells us.
Large-Scale Findings
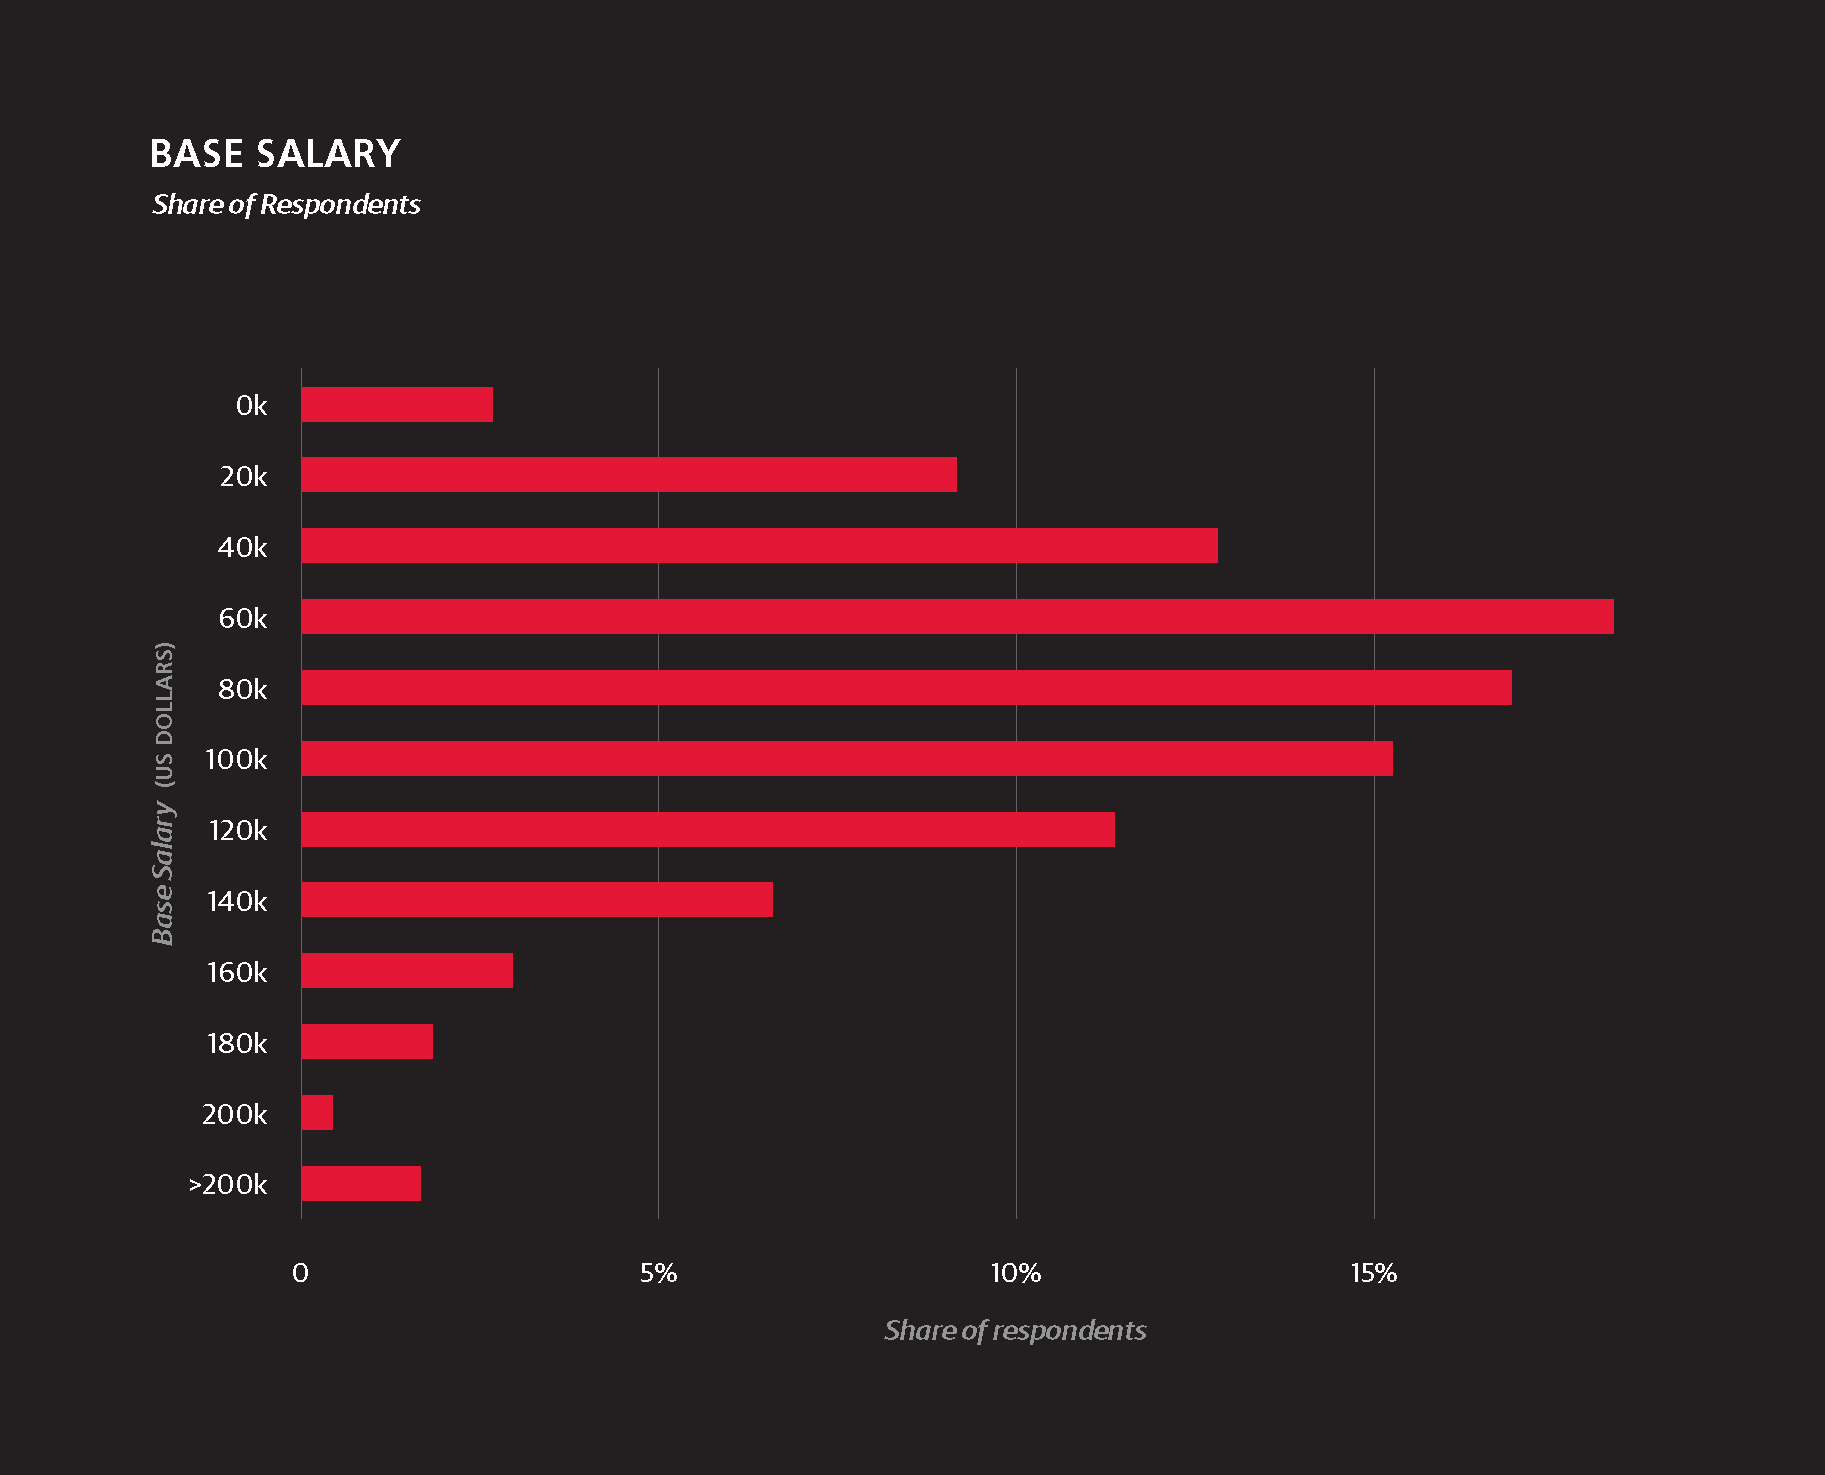
THE MEDIAN SALARY IS $78,000 (we use US dollars for all
money in this report). Naturally, there is a lot of variation, but
75% of respondents had a salary of at least $50,000, and 25%
had a salary of at least $109,000. Things are changing fast,
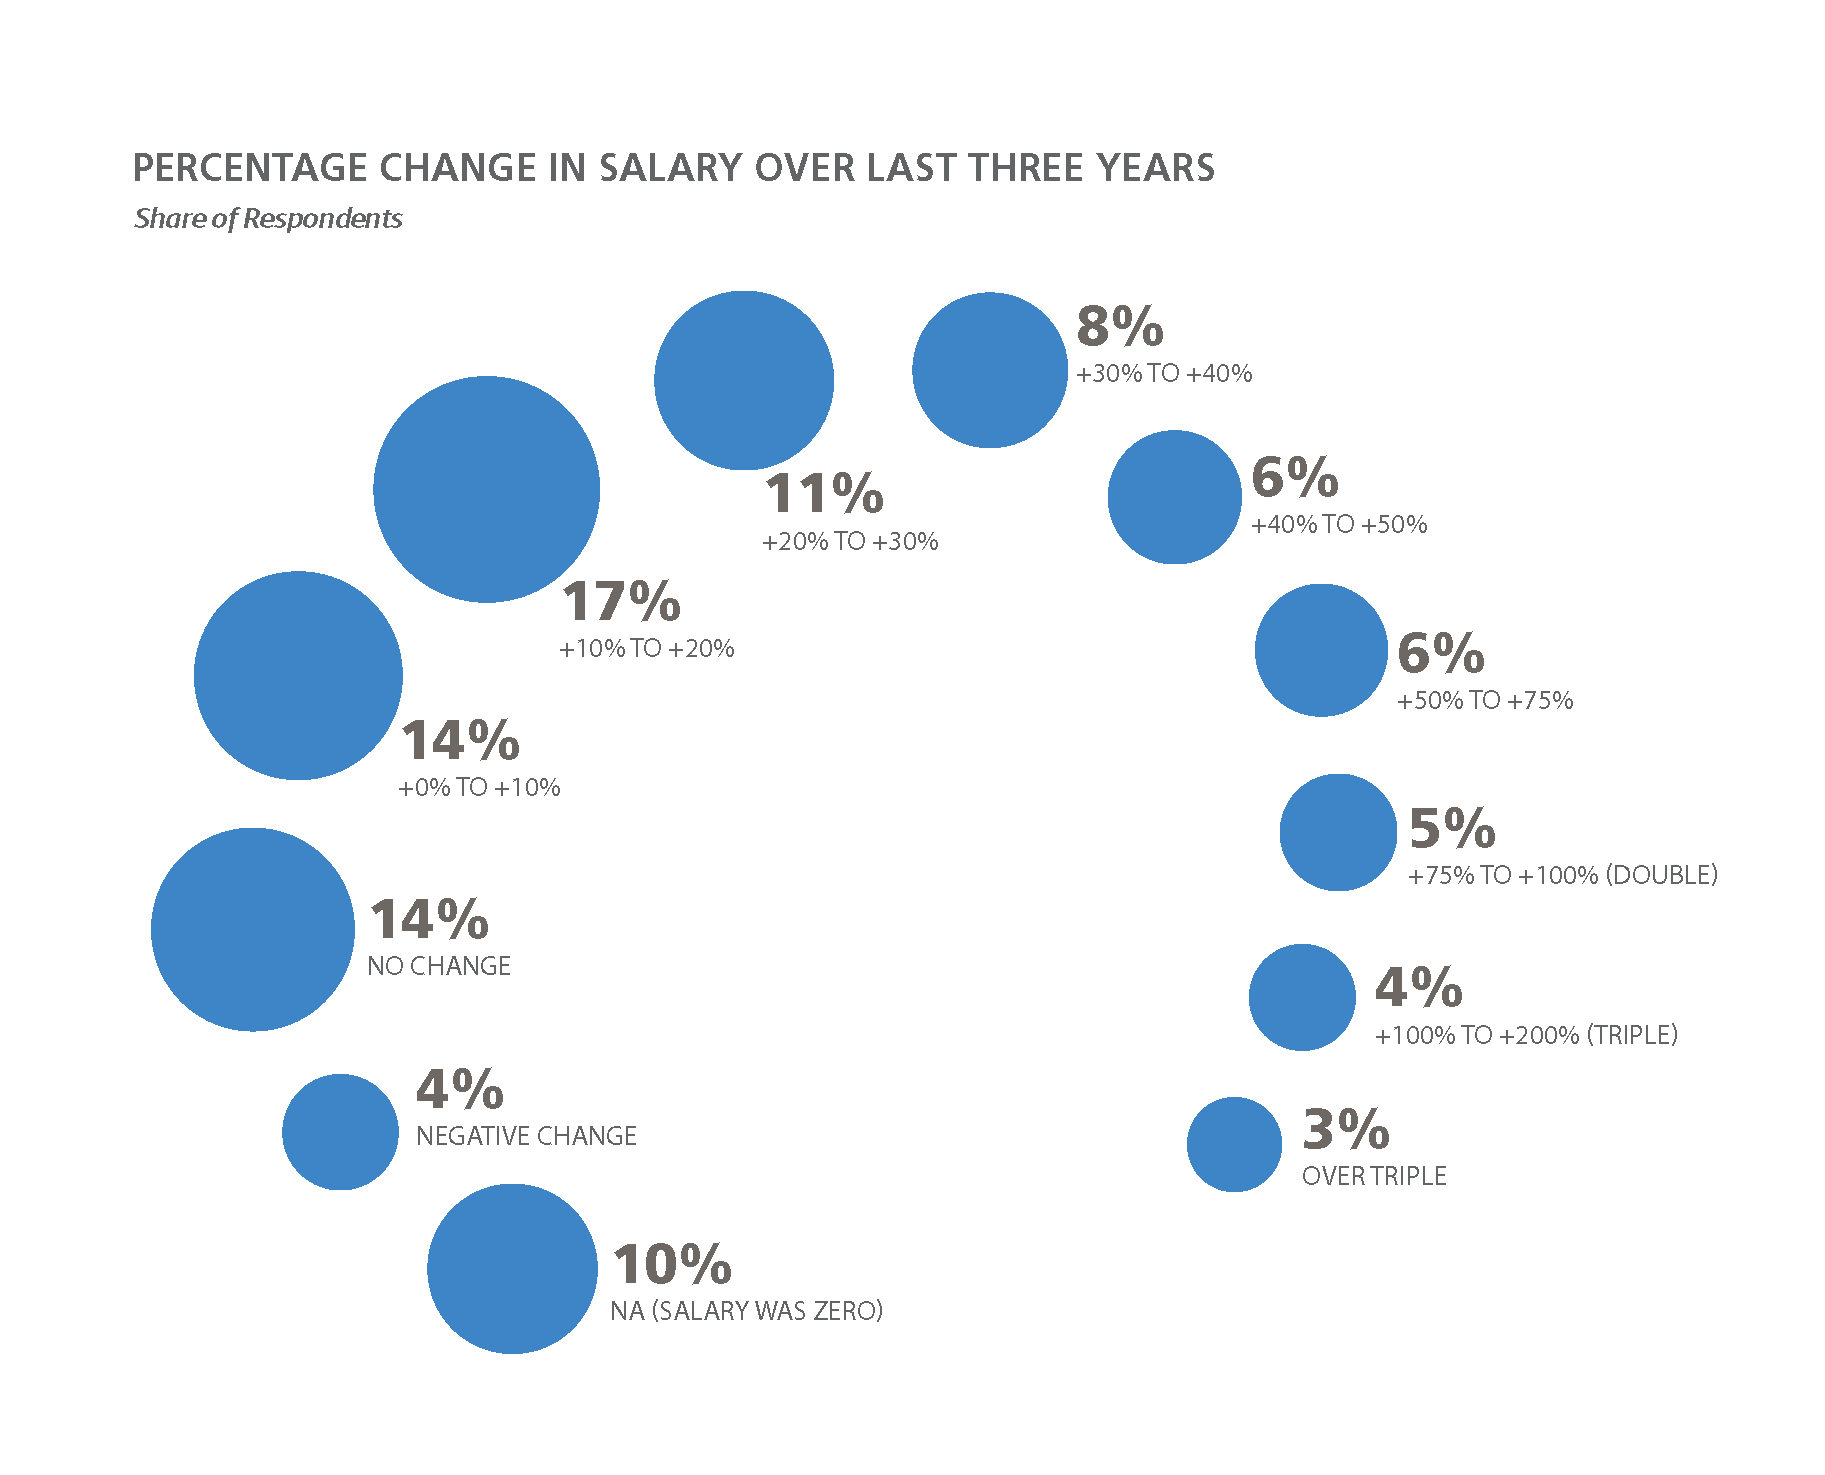
though: salaries rise quickly. 17% of respondents reported a
salary raise of 20% to 30% over the past three years. The salary
raises also form a bell curve around this 17%. For instance,
although 5% reported a decrease in salary, 16% reported that
their salaries had doubled, or even done better, over three years.
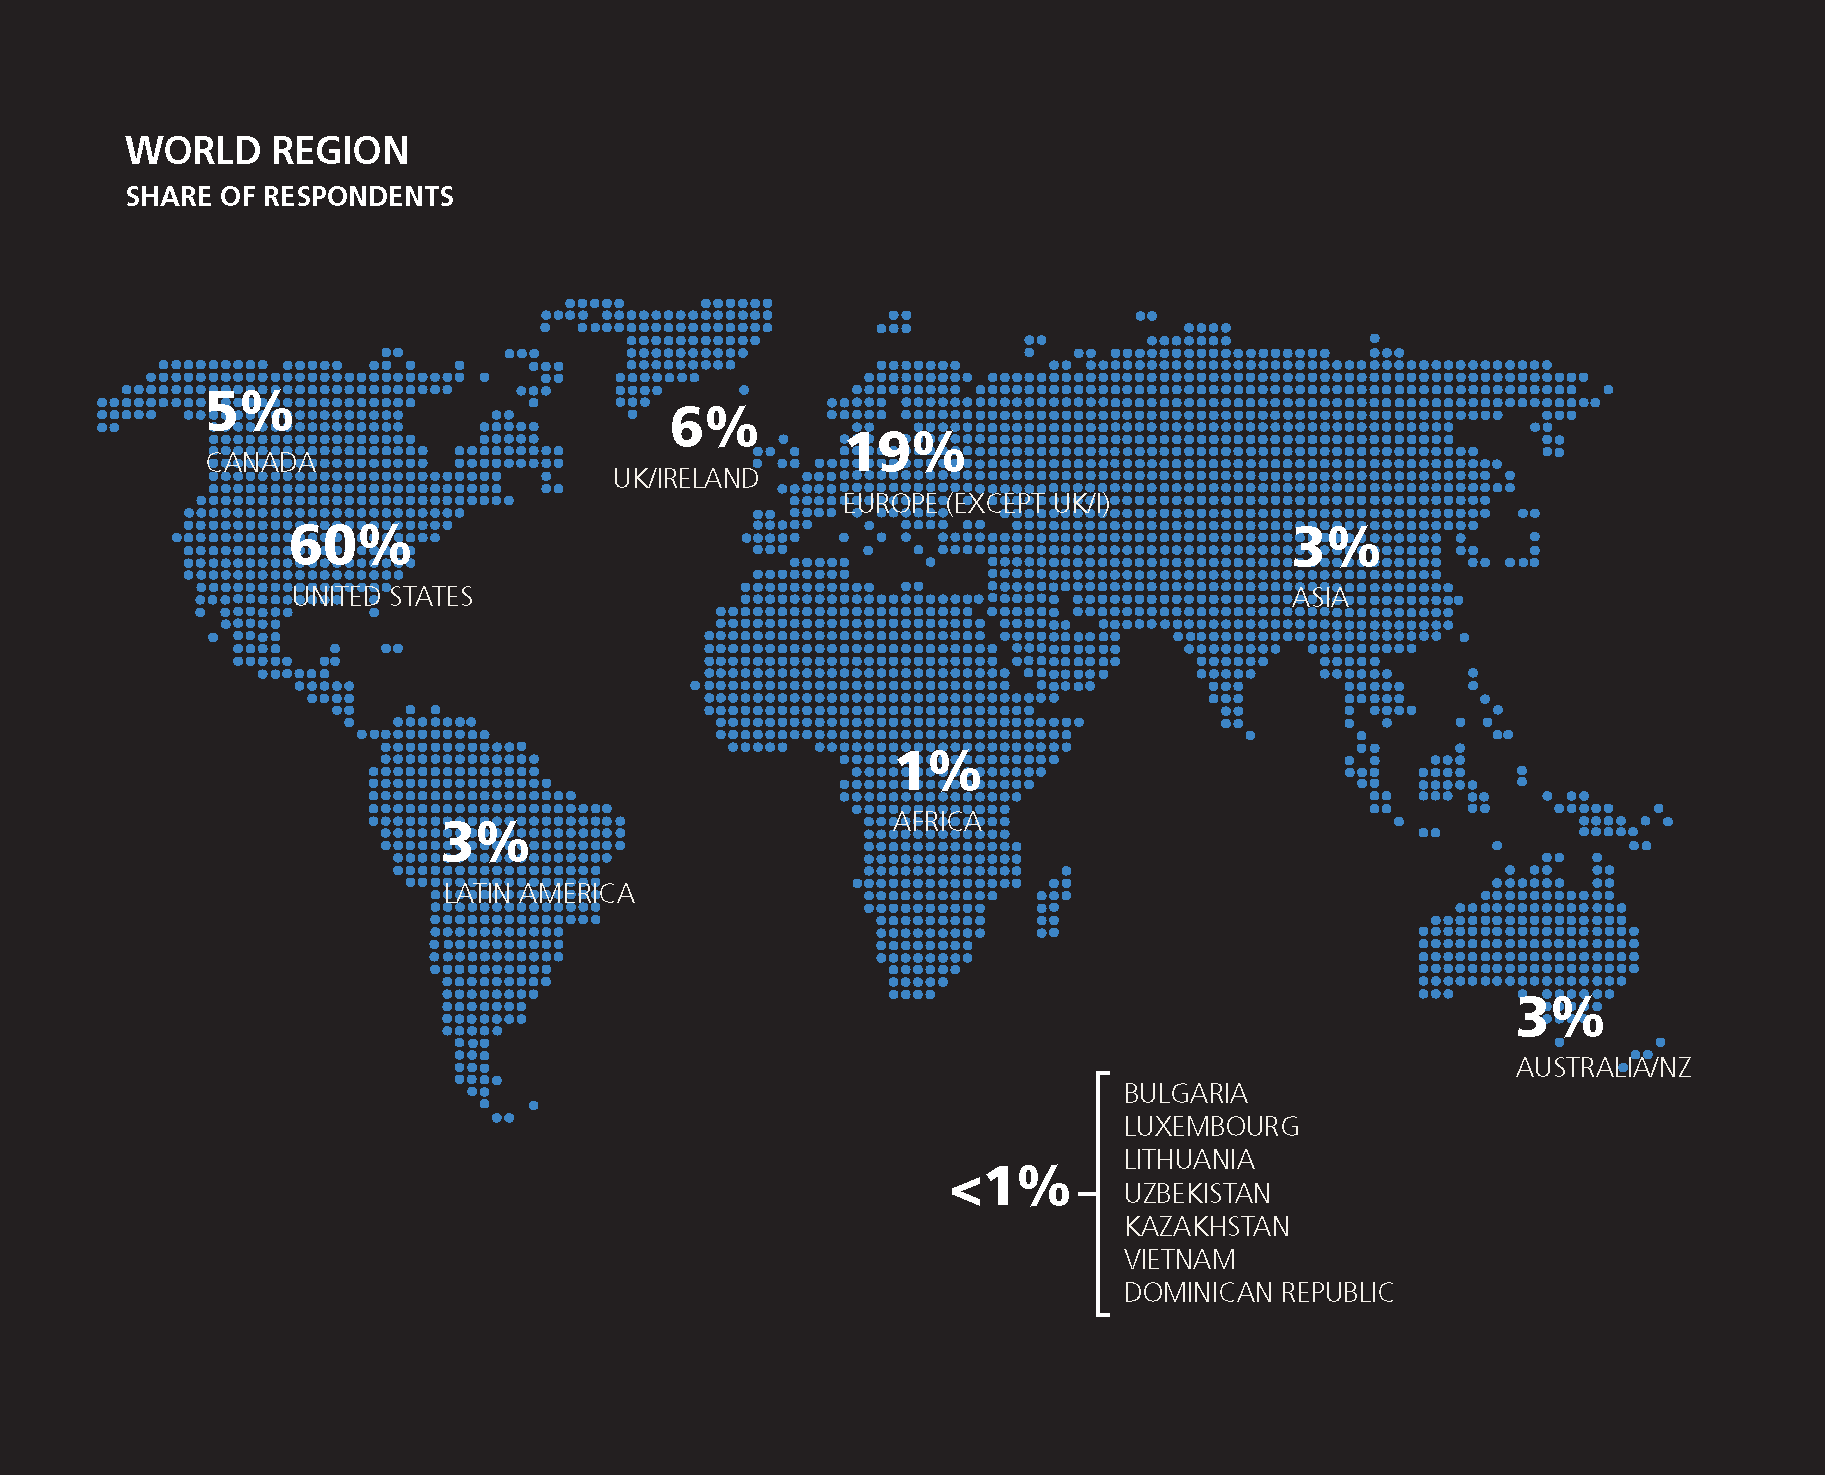
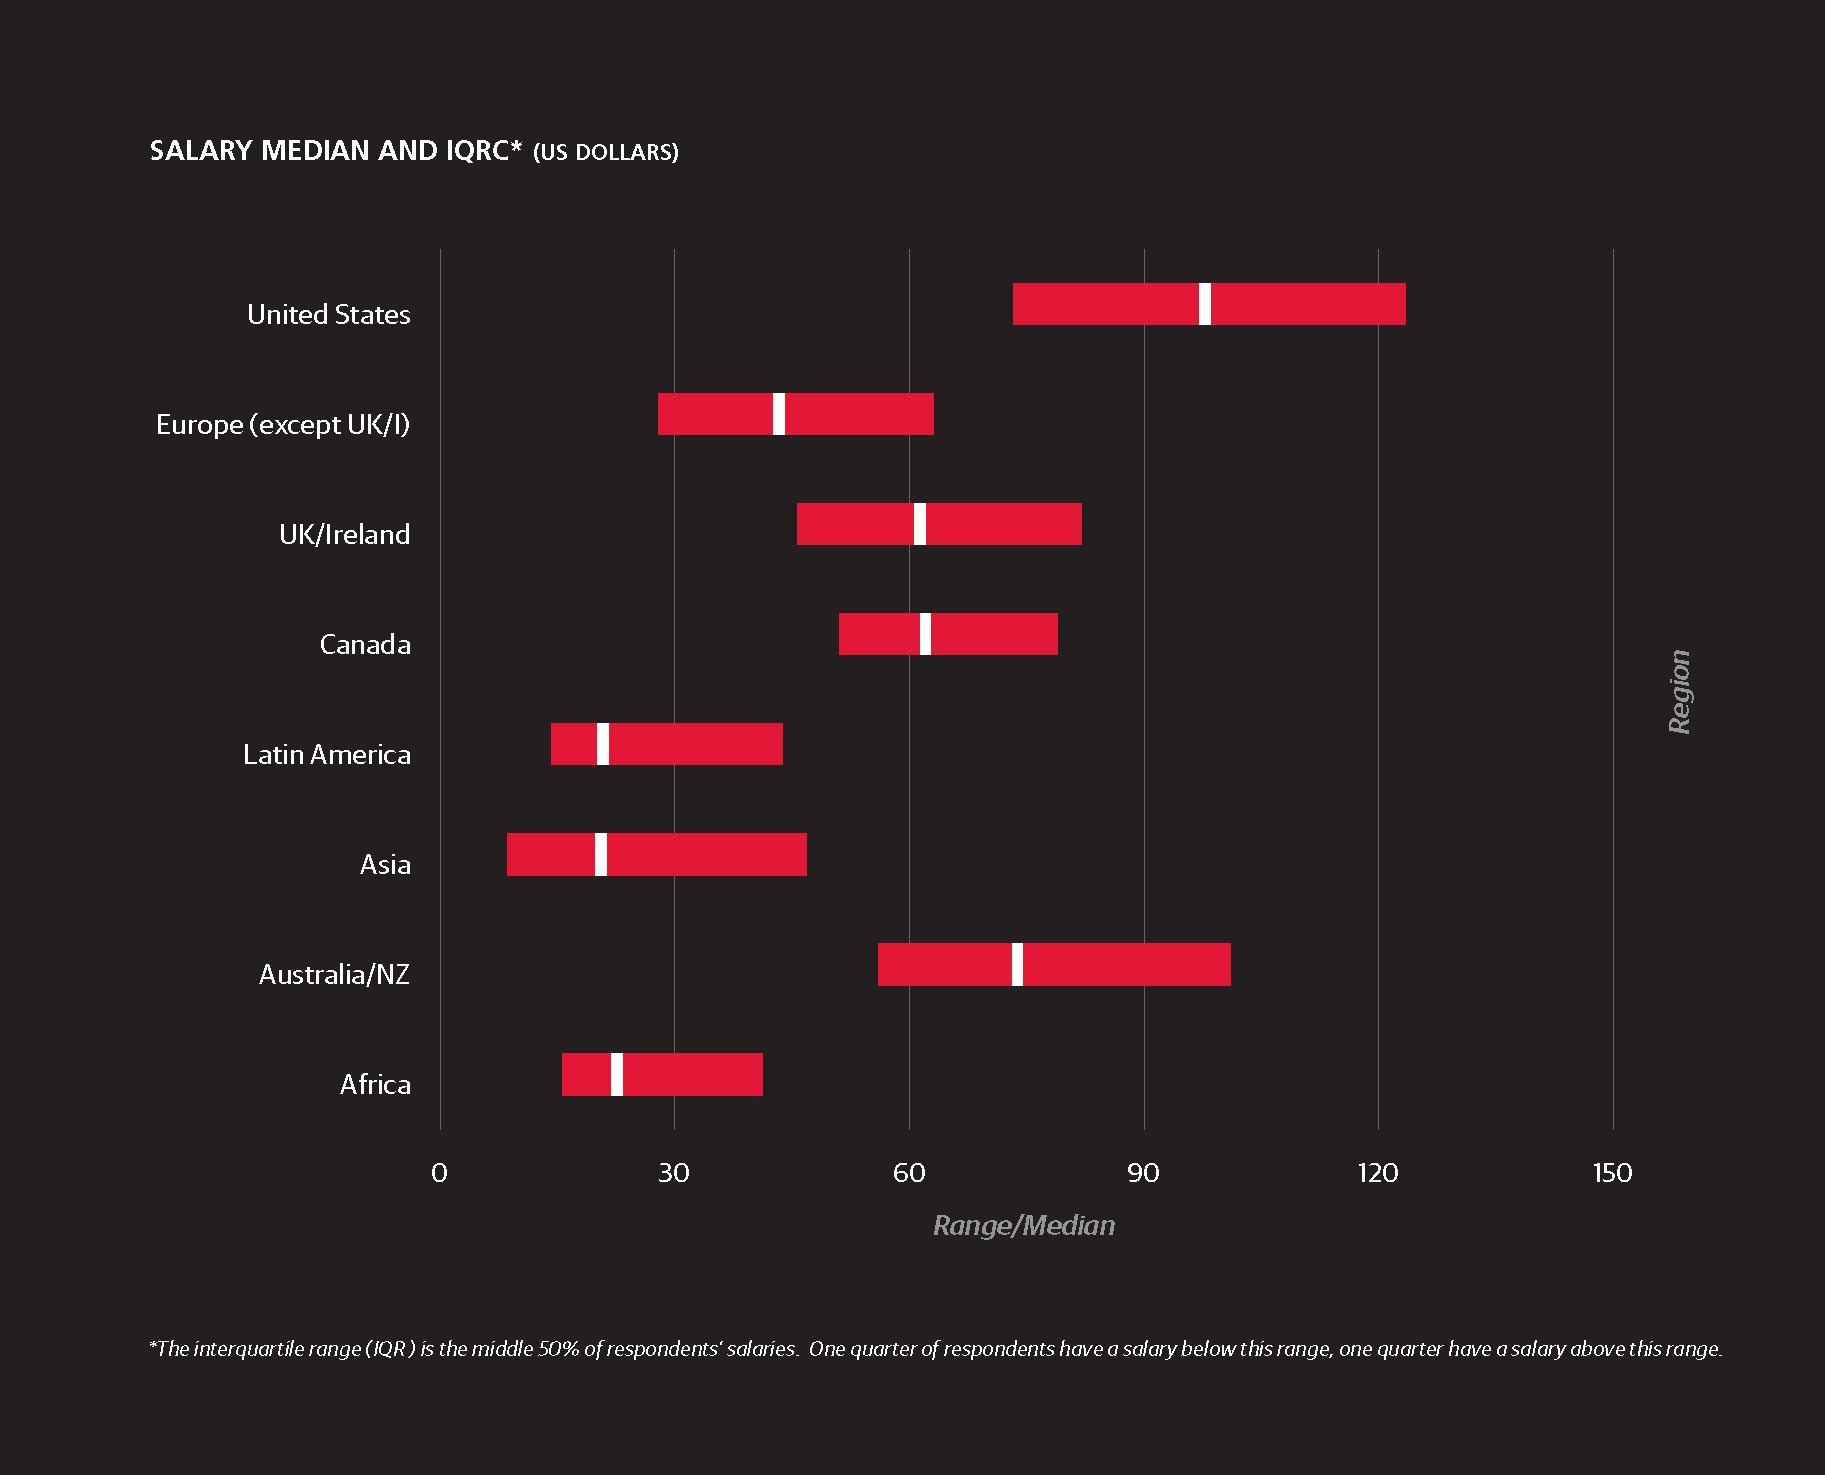
The United States paid the highest salaries, with the average
being $98,000. Canada was also pretty high, with a median
of $79,000 (in US dollars), and Australia/New Zealand at
$74,000. Compensation drops off rapidly after that:
-
UK and Ireland: average of $62,000
-
Rest of Europe: average of $43,000
-
Africa: average of $23,000 (but there was a rather high
top quartile of $41,000) -
Asia: average of $21,000 (with a high top quartile of
$47,000) -
Latin America: average of $21,000 (with a high top
quartile of $44,000)
The top quartile means that 25% of respondents earned more
than the amount listed. Of course, countries differ in taxation
and the benefits they offer, so salaries have somewhat different
meanings in different countries.
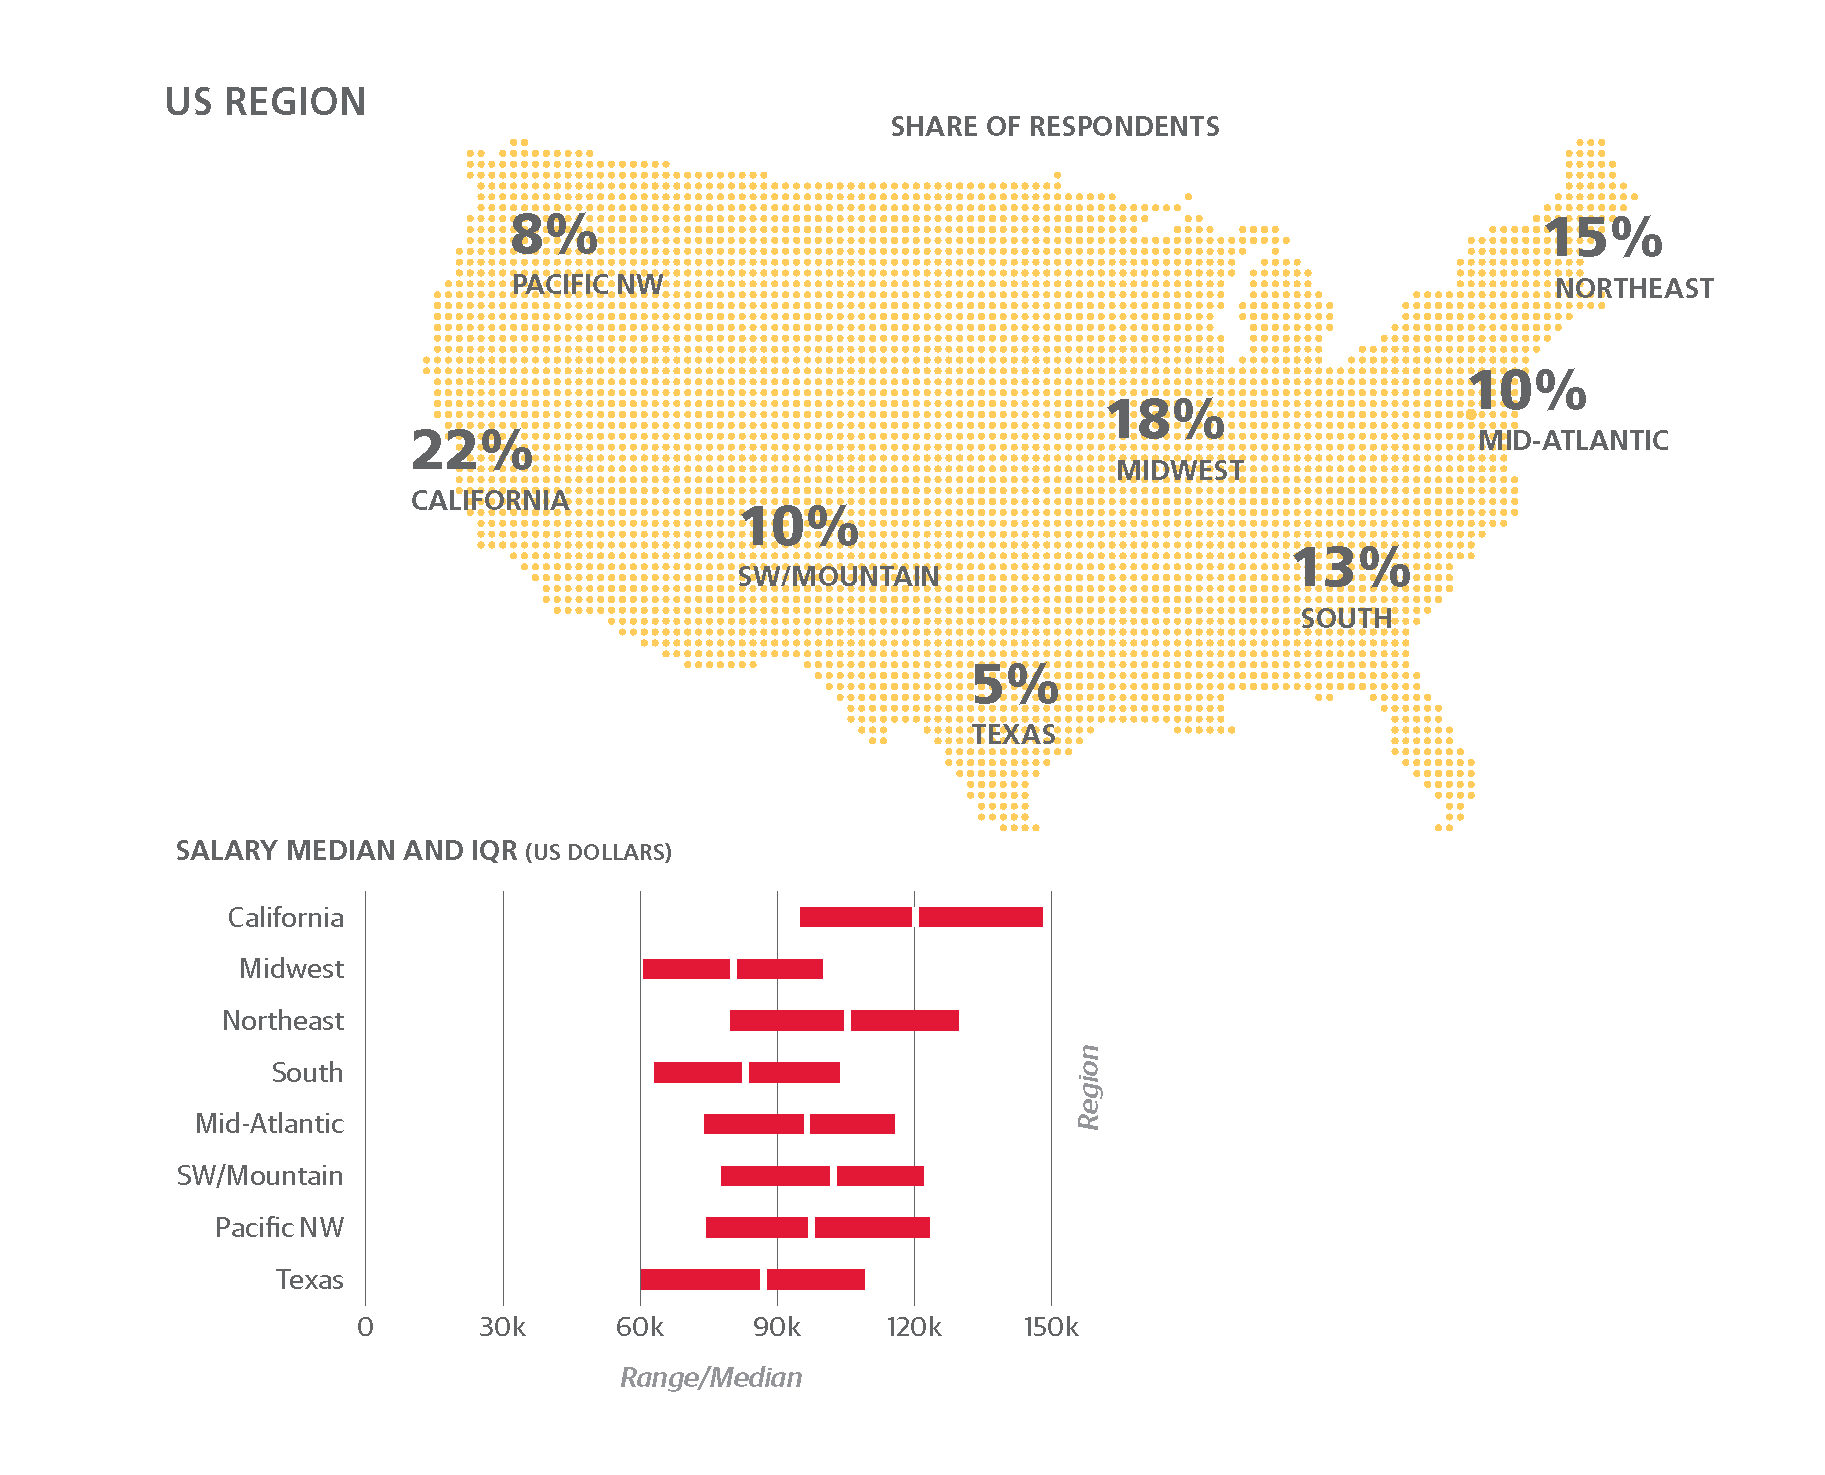
Because we got a lot of respondents from the US, we could
break them down by region. High salaries in California are no
surprise (particularly given the cost of living there), but the
high average in Southwest/Mountain states is rather unexpected.
(This category does not include California, which has
its own category.) Utah, with a large web developer community,
as well as Colorado and Arizona all saw high salaries.
-
California: average of $120,000
-
Northeast: average of $105,000
-
Southwest/Mountain: average of $102,000
-
Pacific Northwest: average of $98,000
-
Mid-Atlantic: average of $96,000
-
South: average of $83,000
-
Midwest: average of $80,000
Next let’s drill down into the differences between respondents.
The data might affect your career choices.
Developers’ Personal Characteristics
WE FOUND THAT EACH YEAR of experience is worth about
$1,350. That is, if you have five years of experience, you’re
likely to earn $1,350 more than someone who is similar to you
but has only four years of experience.
Education makes a big difference in salary—something that
may be surprising, given that the web contains a lot of people
who are self-taught or who got brief educational experiences
at for-profit programs. If you have a doctorate, you can expect
to earn on average $10,434 more than someone without one.
Strangely enough, possessing a master’s degree is slightly bad
for salary: respondents with master’s degrees earned $542
less, all else being equal.
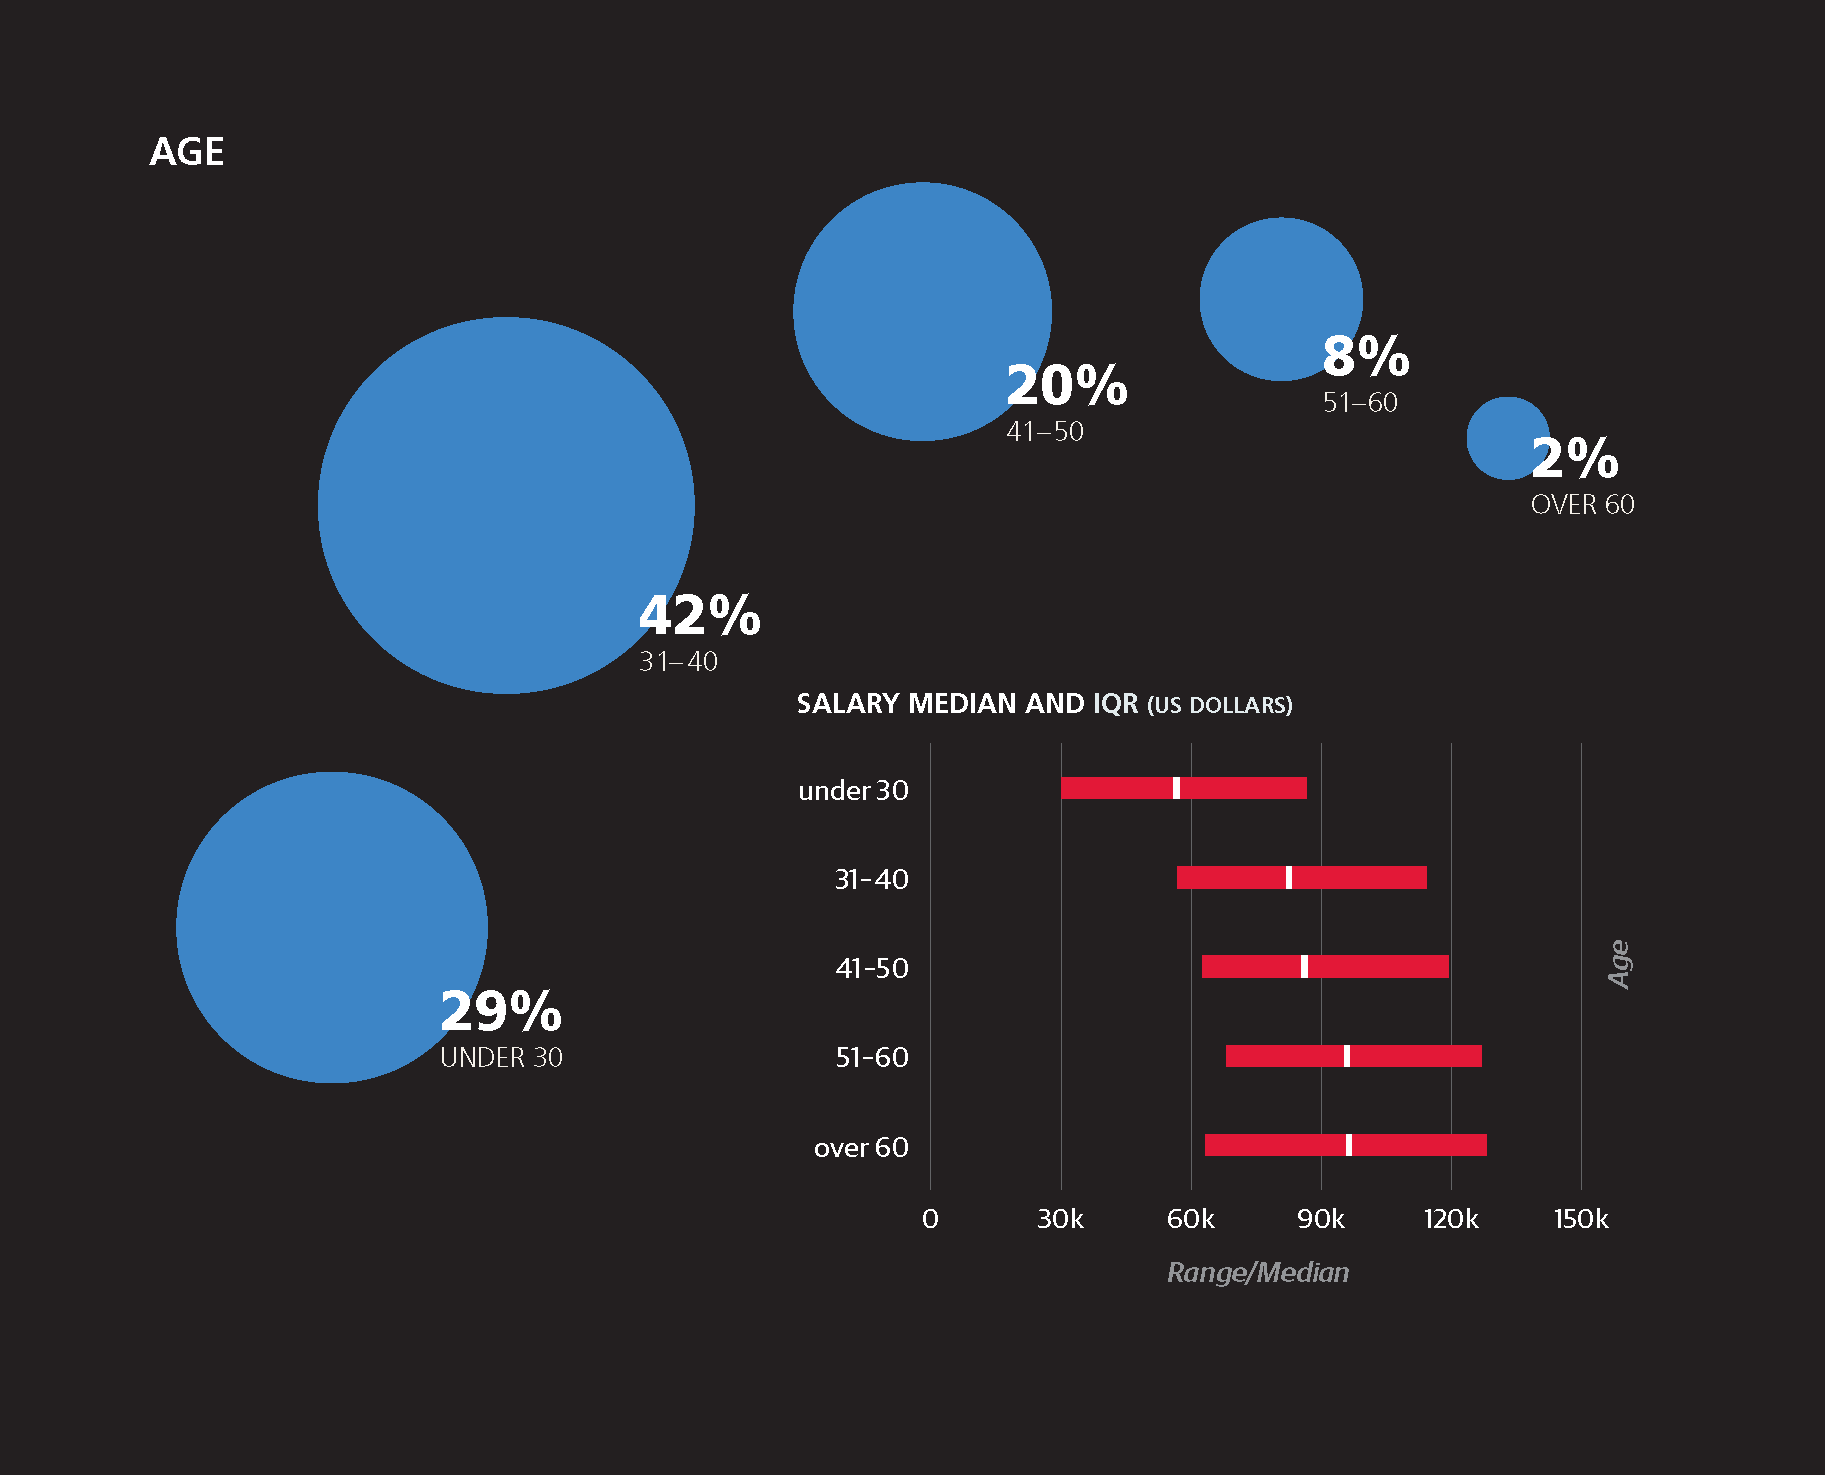
Although older respondents tended to earn more, this was
attributable to years of experience. When experience is held
constant, respondents in the 26 to 30 and 31 to 35 groups
earned the most, with an advantage of $3,932 and $3,347,
respectively, over other age groups. Respondents aged 61
to 65 earned $4,526 less than younger respondents with
similar experience.
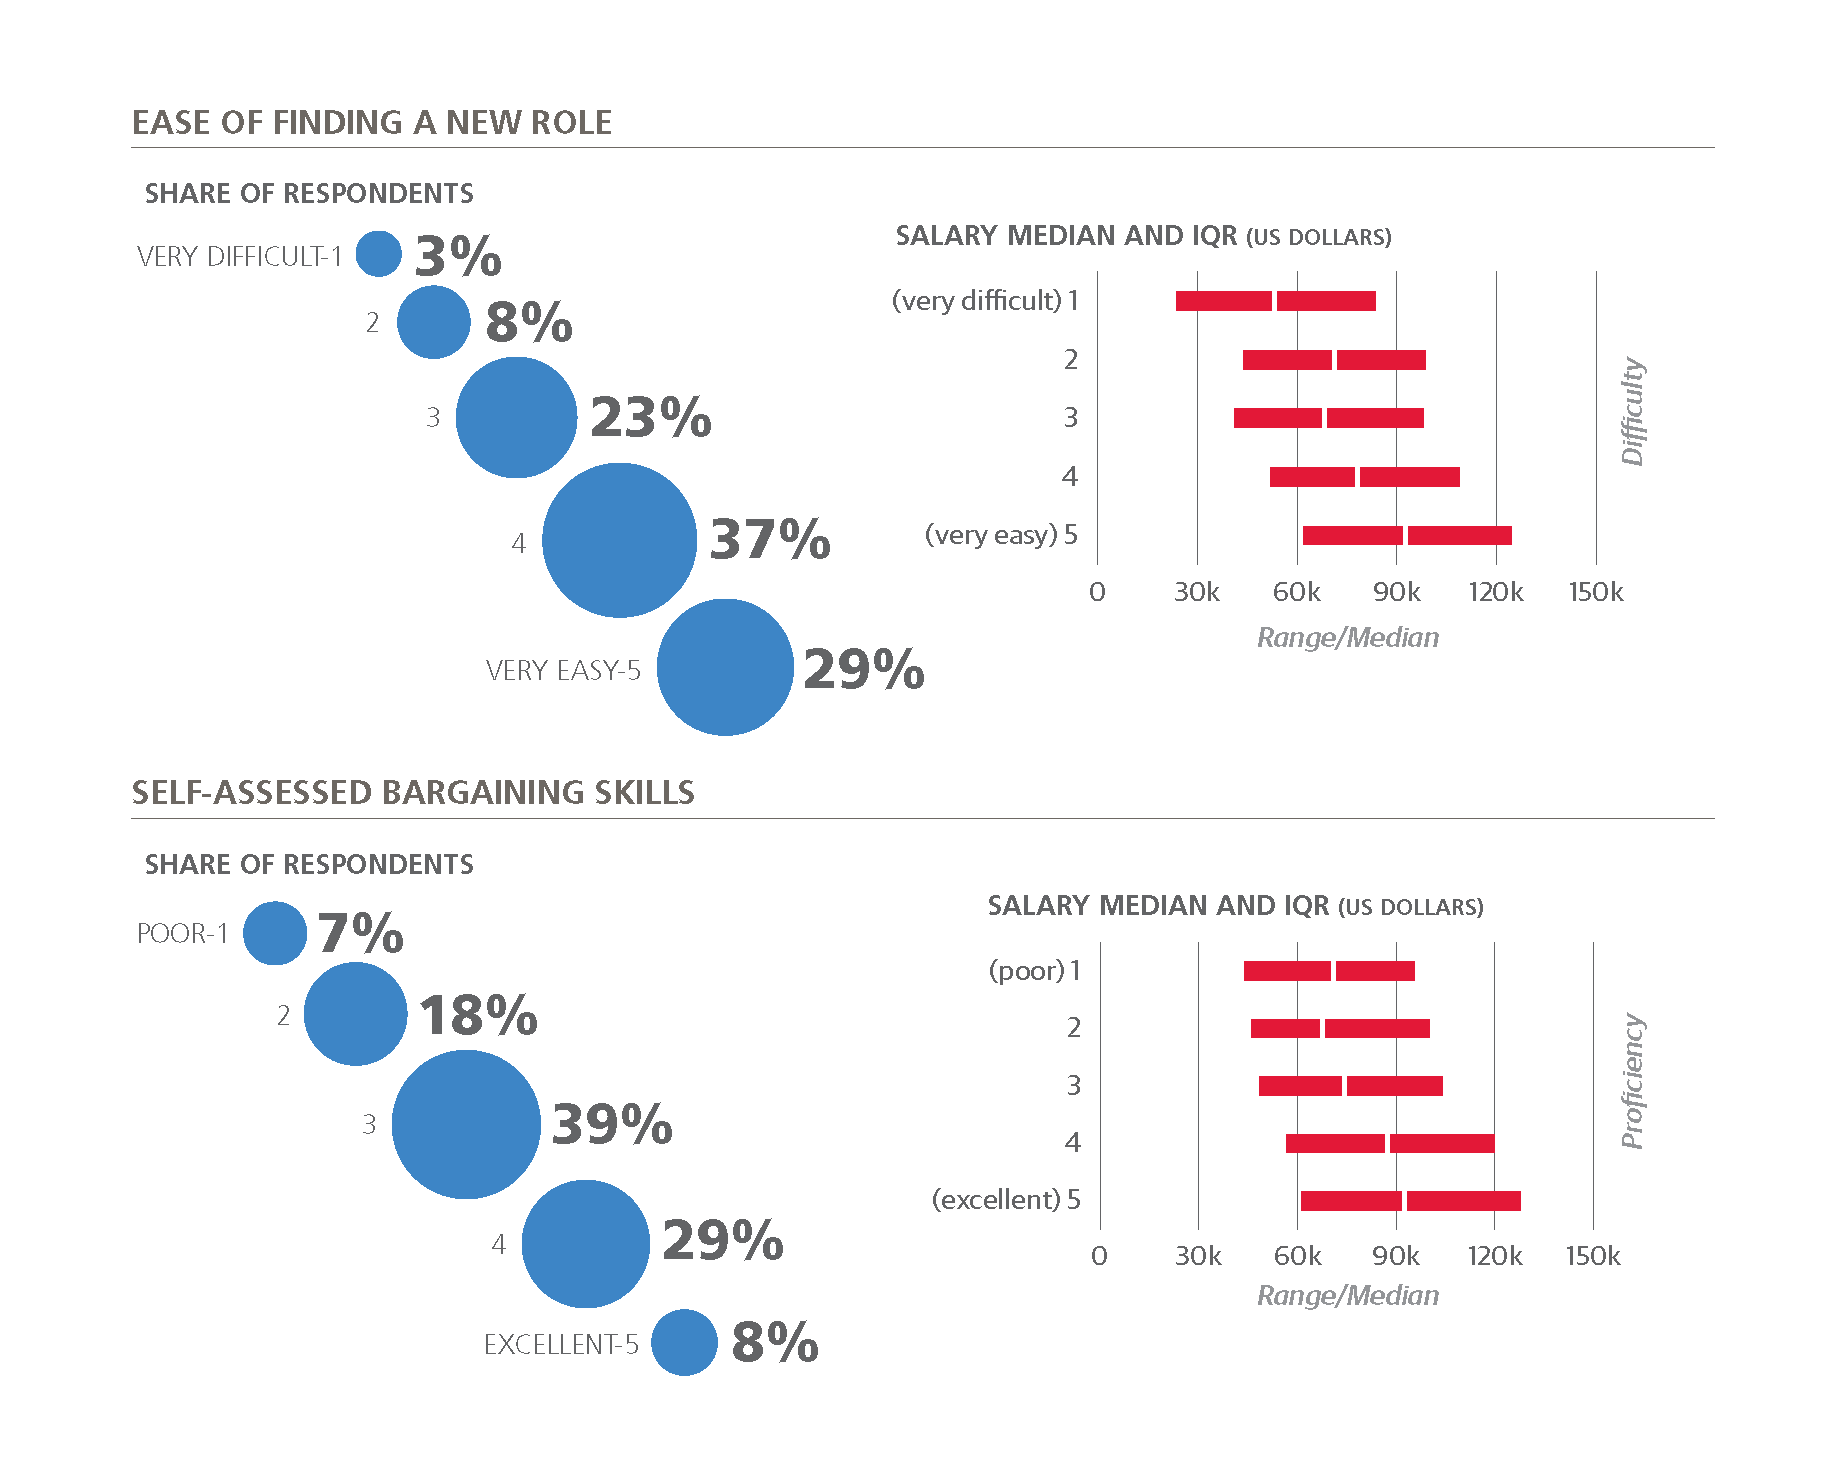
We asked respondents to rate their bargaining skills on a 1- to
5-point scale; 5 meaning they are a very good bargainer.
(While this rating is very subjective, the subjectivity is appropriate
for this question because so much about bargaining
has to do with confidence and being able to assess yourself
highly.) For every self-assessed bargaining point, the respondent’s
salary estimate goes up by $5,695. So holding everything
else constant, someone who gave themselves 5 points
will make 4 x $5,695 = $22,780 more than someone with
1 point.
Gender had a predictable influence on salary in the web field.
Our analysis showed that everything else being equal, men
earned an average of $2,165 more than women.

Company Characteristics
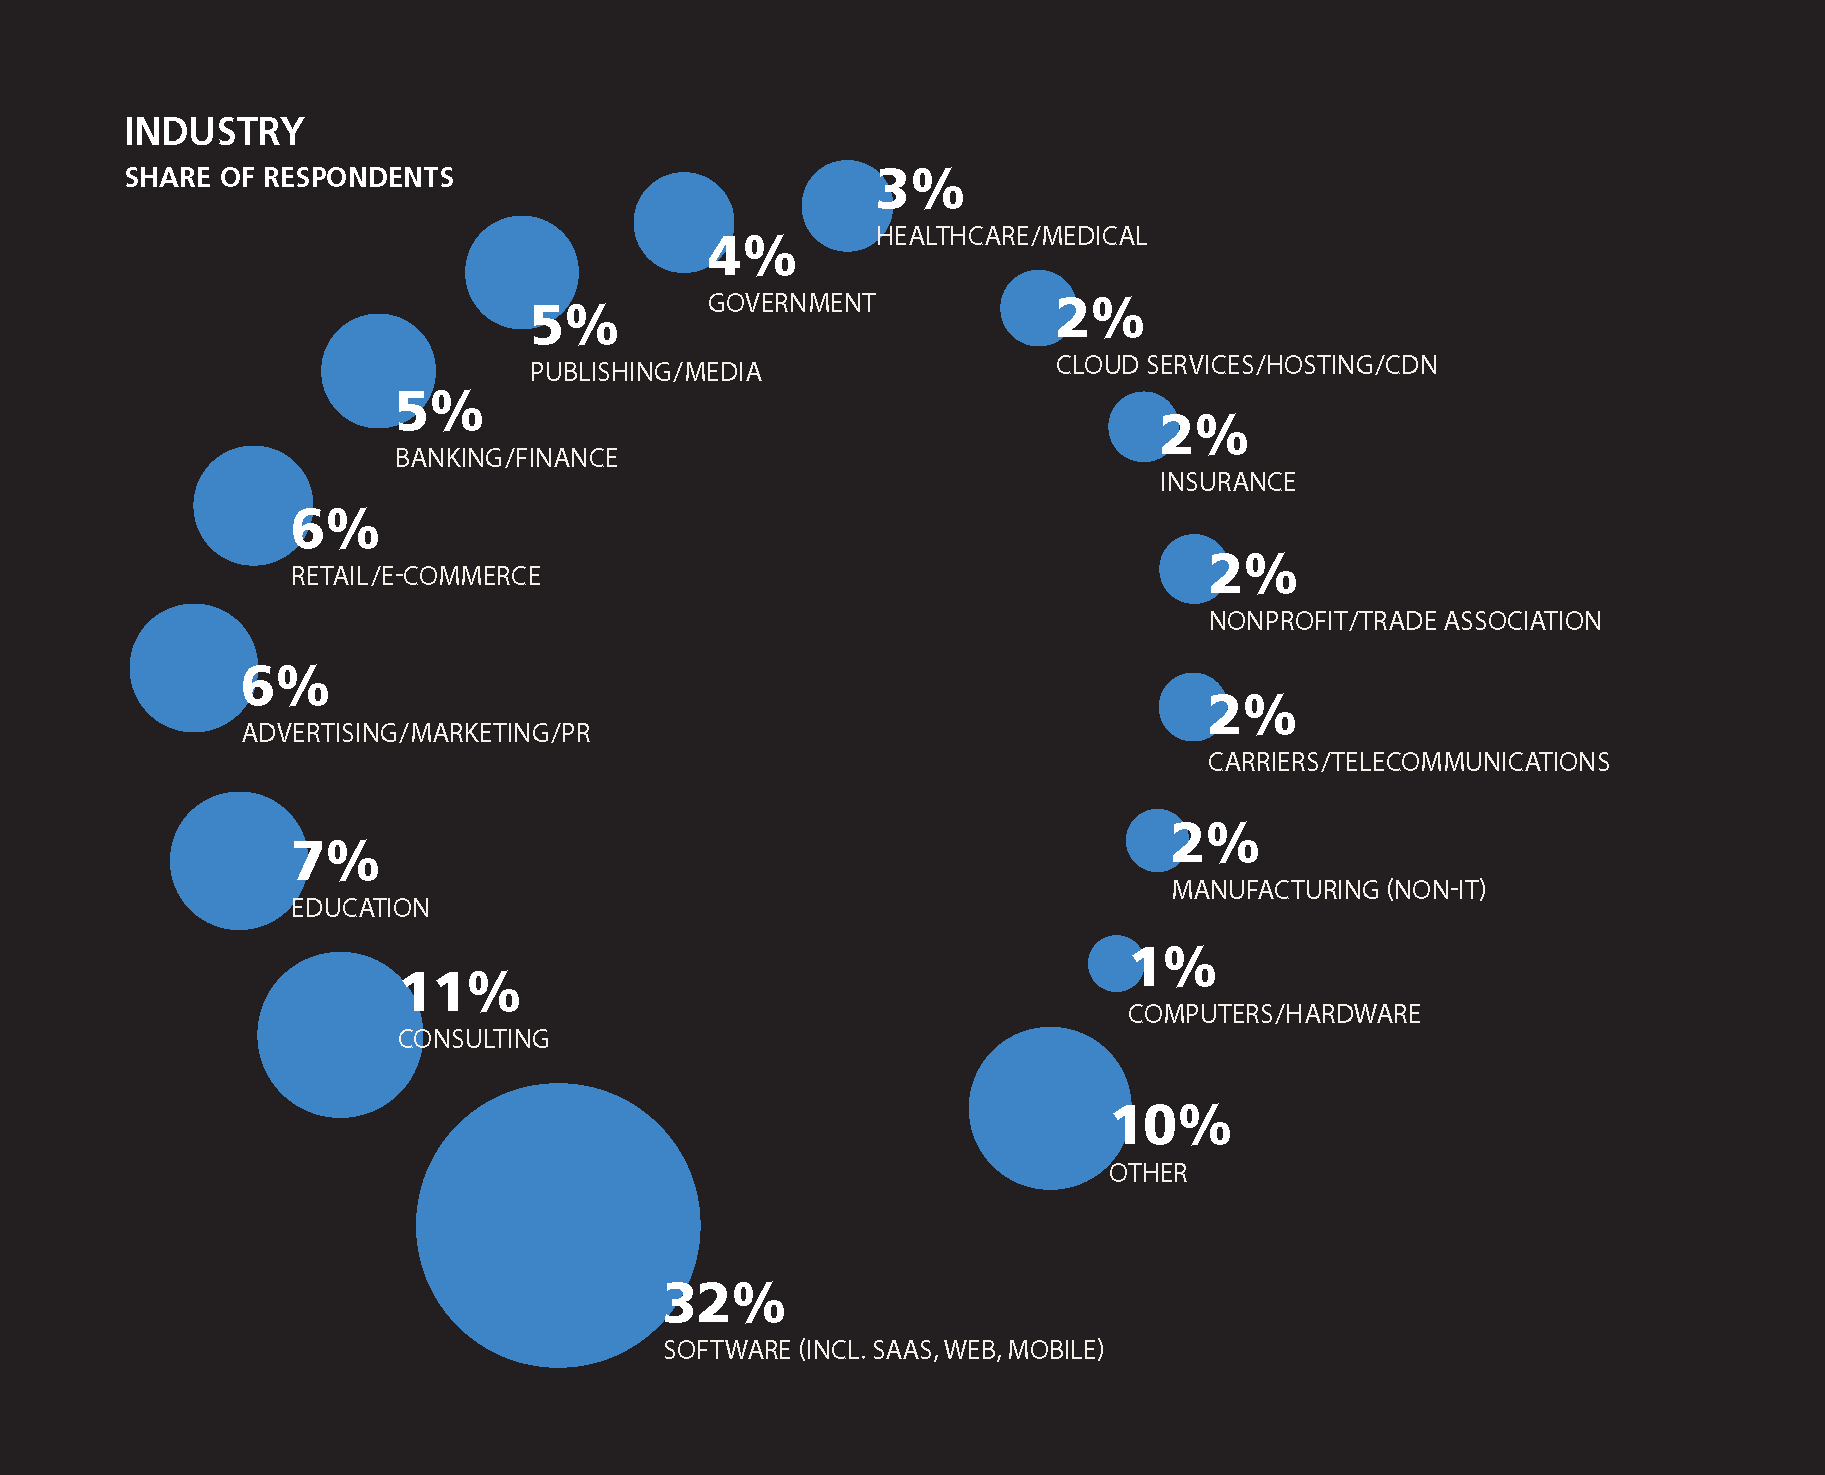
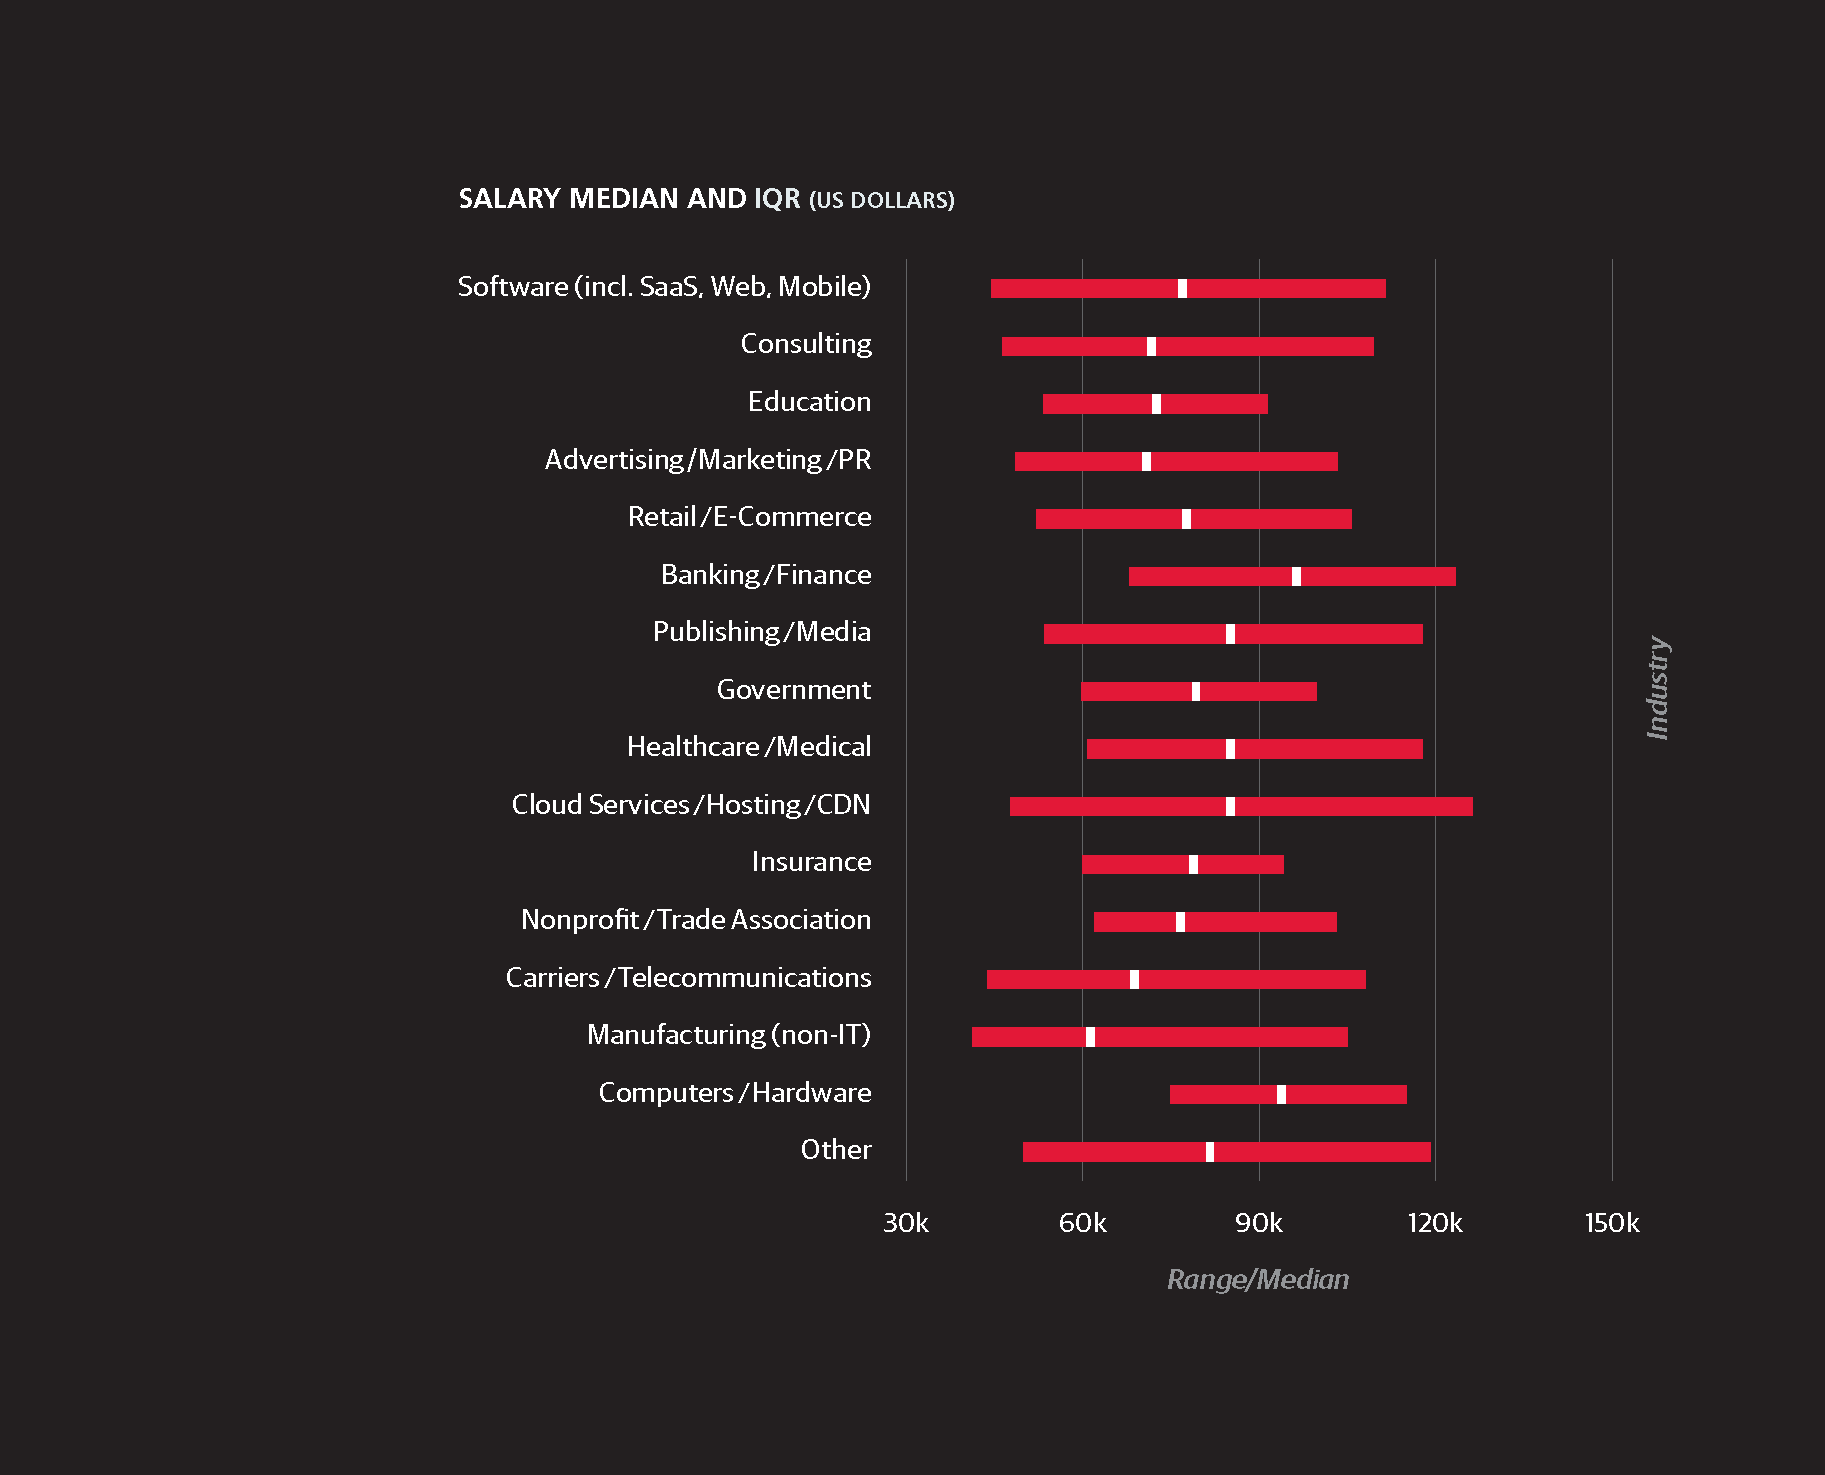
THE BEST INDUSTRIES TO WORK FOR, in terms of salary,
were search/social networking and banking/finance. If you are
in search/social networking, you probably earn a whopping
$15,193 more than someone with comparable experience
and characteristics in other industries. In banking/finance,
you can earn $7,043 more. There are a couple of other
advantageous fields:
-
Software (including SaaS, web, mobile): $2,142 better
than average -
Publishing/media: $1,376 better than average
But you will be penalized for working in the
following industries:
-
Education: $8,608 worse than average
-
Carriers/telecommunications: $1,547 worse than average
And think twice before becoming a consultant: they earn
$8,448 less than average.
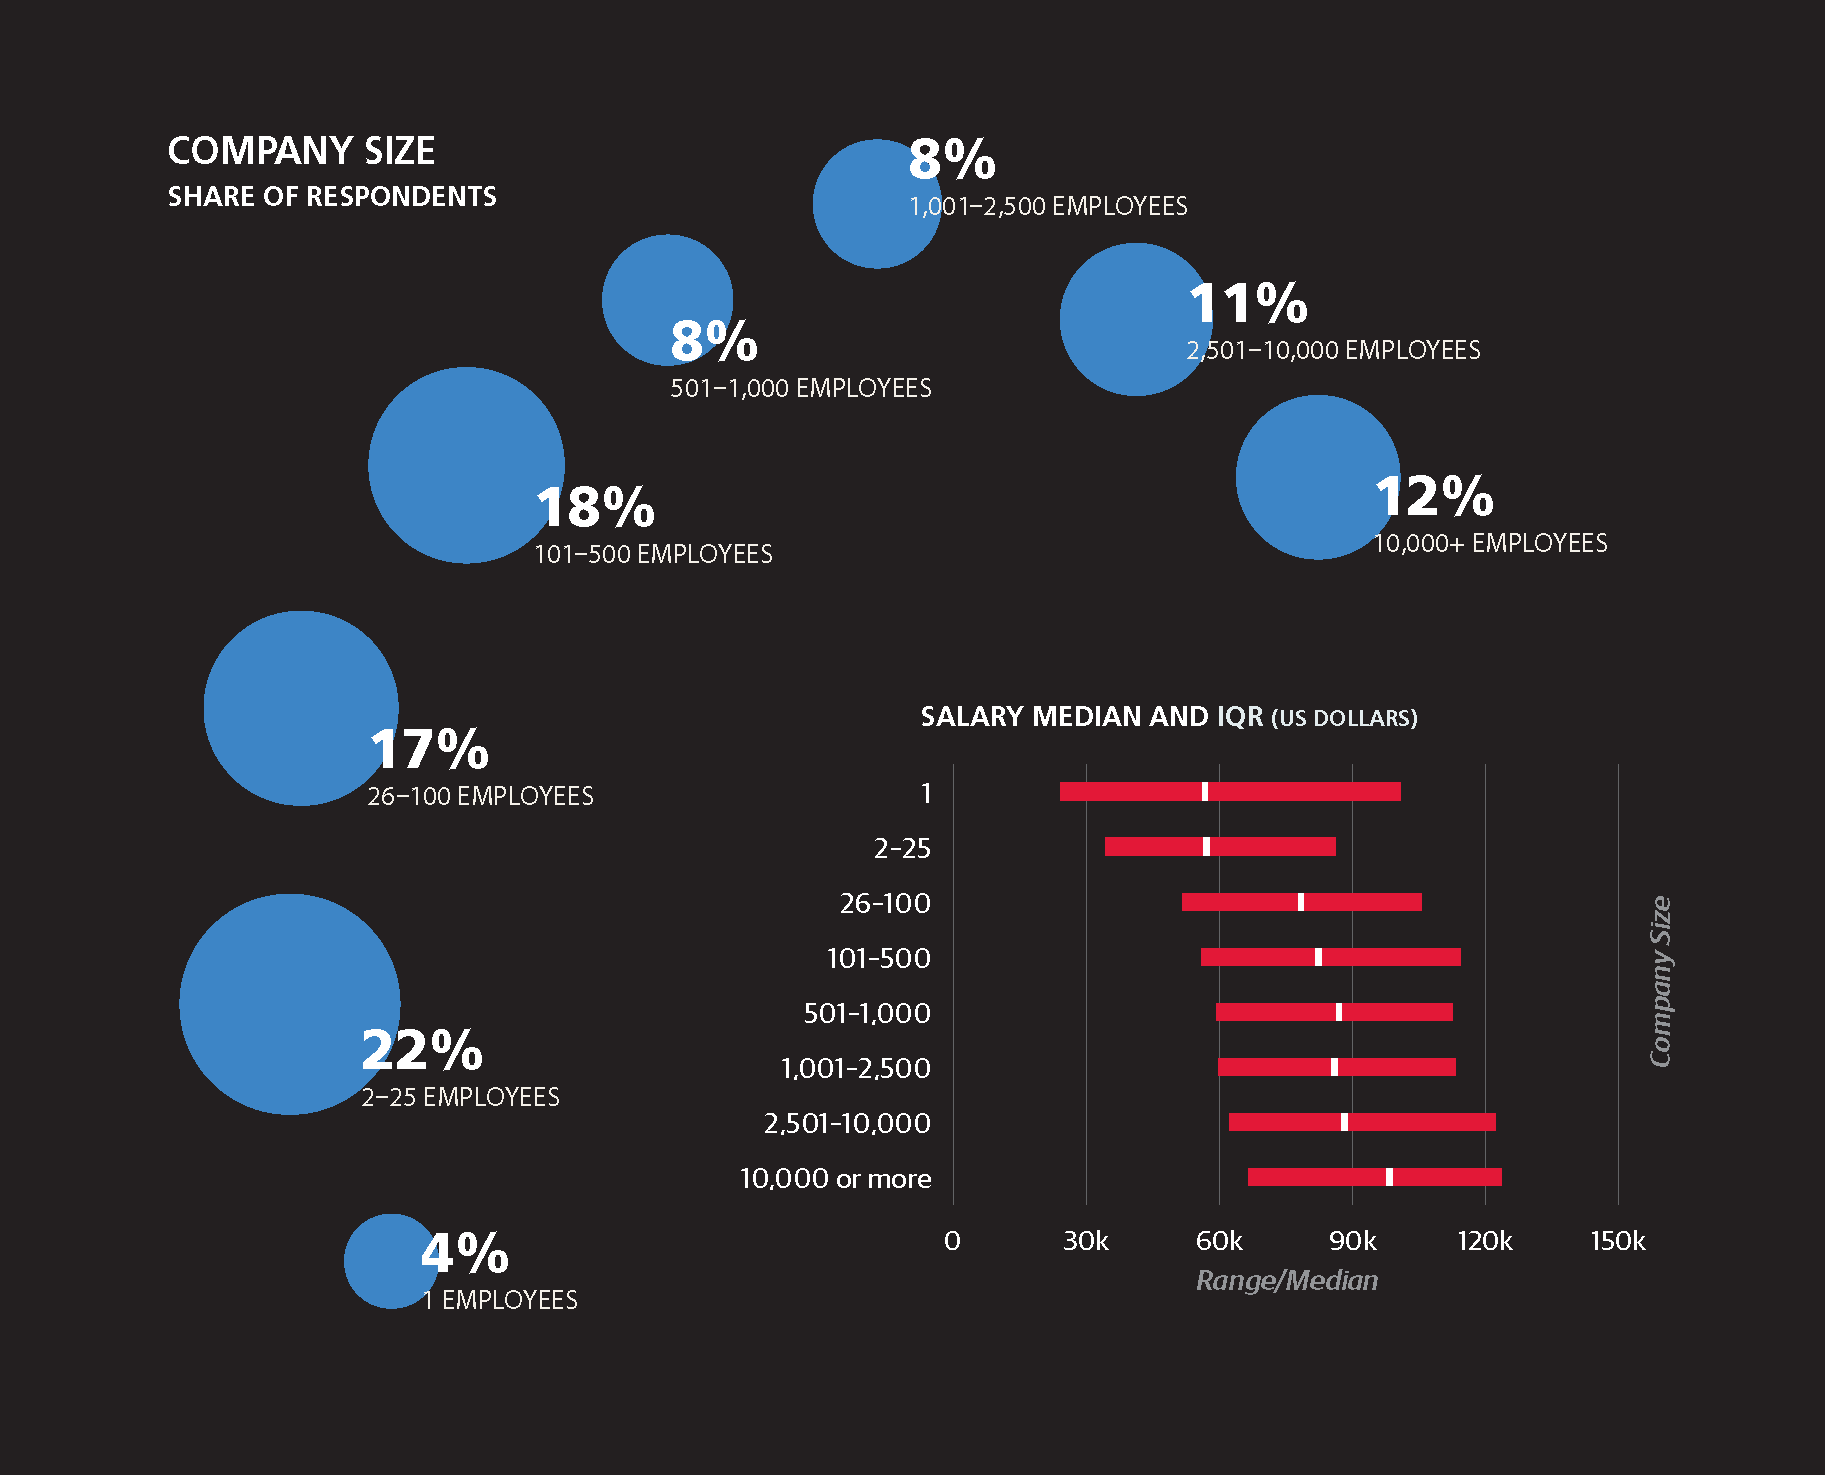
Company size had a major impact on salary, but not on a
simple linear curve. It looks fairly simple, salary increasing with
company size. But when we factor in all the other differences
between employees, it looks like the best salaries are given
out in firms of 1,001 to 2,500 employees, and the next best
size is 101 to 500.
-
1 (4% of respondents): average salary $57,000
-
2 to 25 (22% of respondents): average salary $57,000
-
26 to 100 (17% of respondents): average salary $78,000
-
101 to 500 (18% of respondents): average salary $82,000
-
501 to 1,000 (8% of respondents): average salary $87,000
-
1,001 to 2,500 (8% of respondents): average salary $86,000
-
2,501 to 10,000 (11% of respondents): average salary $88,000
-
10,000 or more (12% of respondents): average salary $98,000
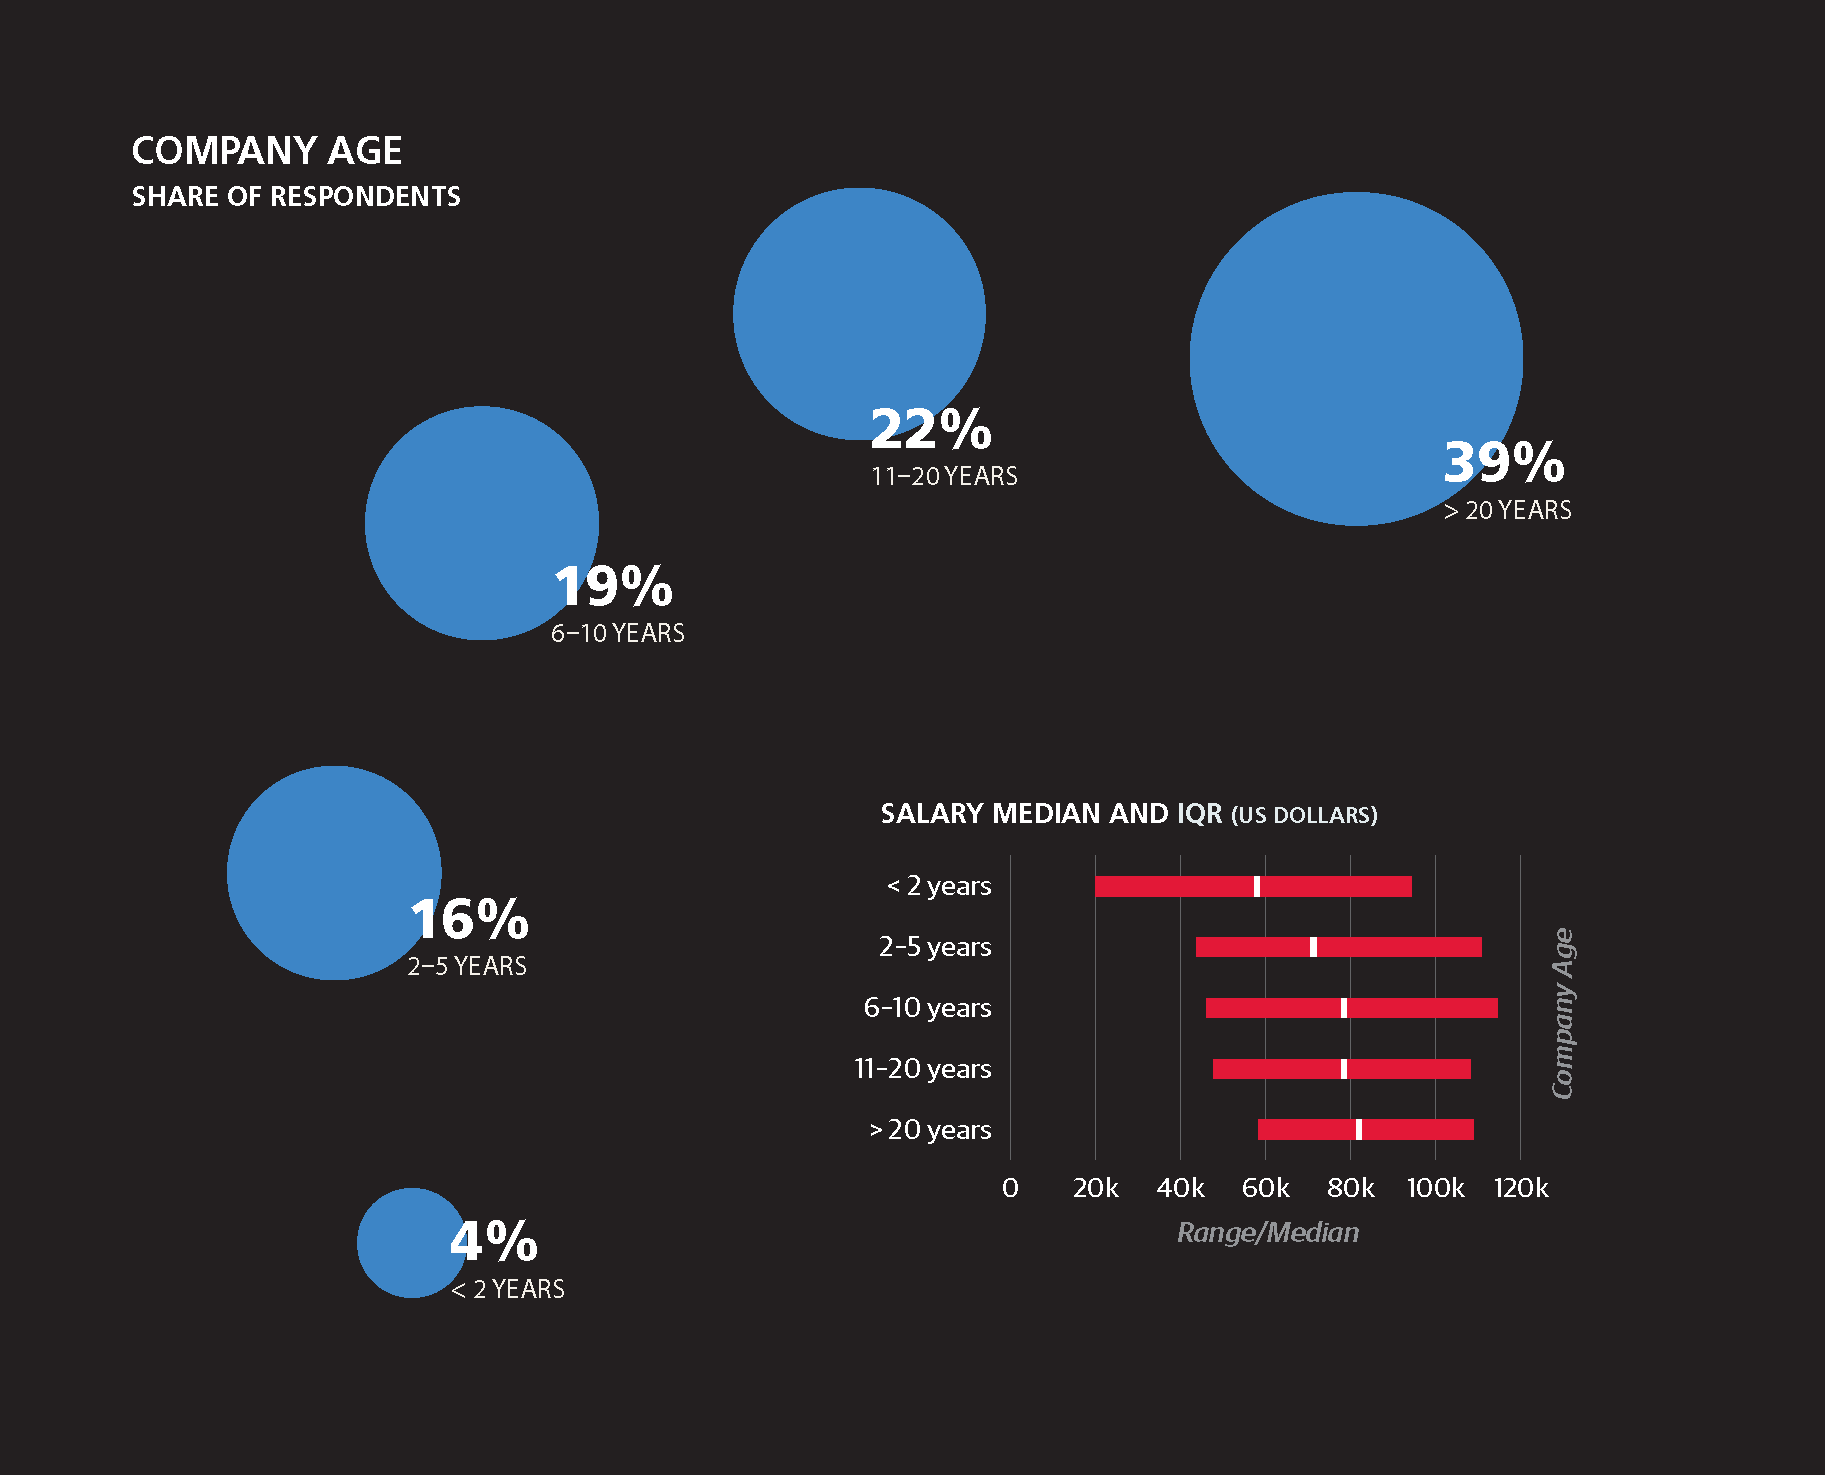
If the company is more than 20 years old, we saw a penalty
of $2,197 for working there. Perhaps this is because people
at such firms stay in one job longer, and don’t experience the
salary boost that others get by moving to new firms.
Job Characteristics
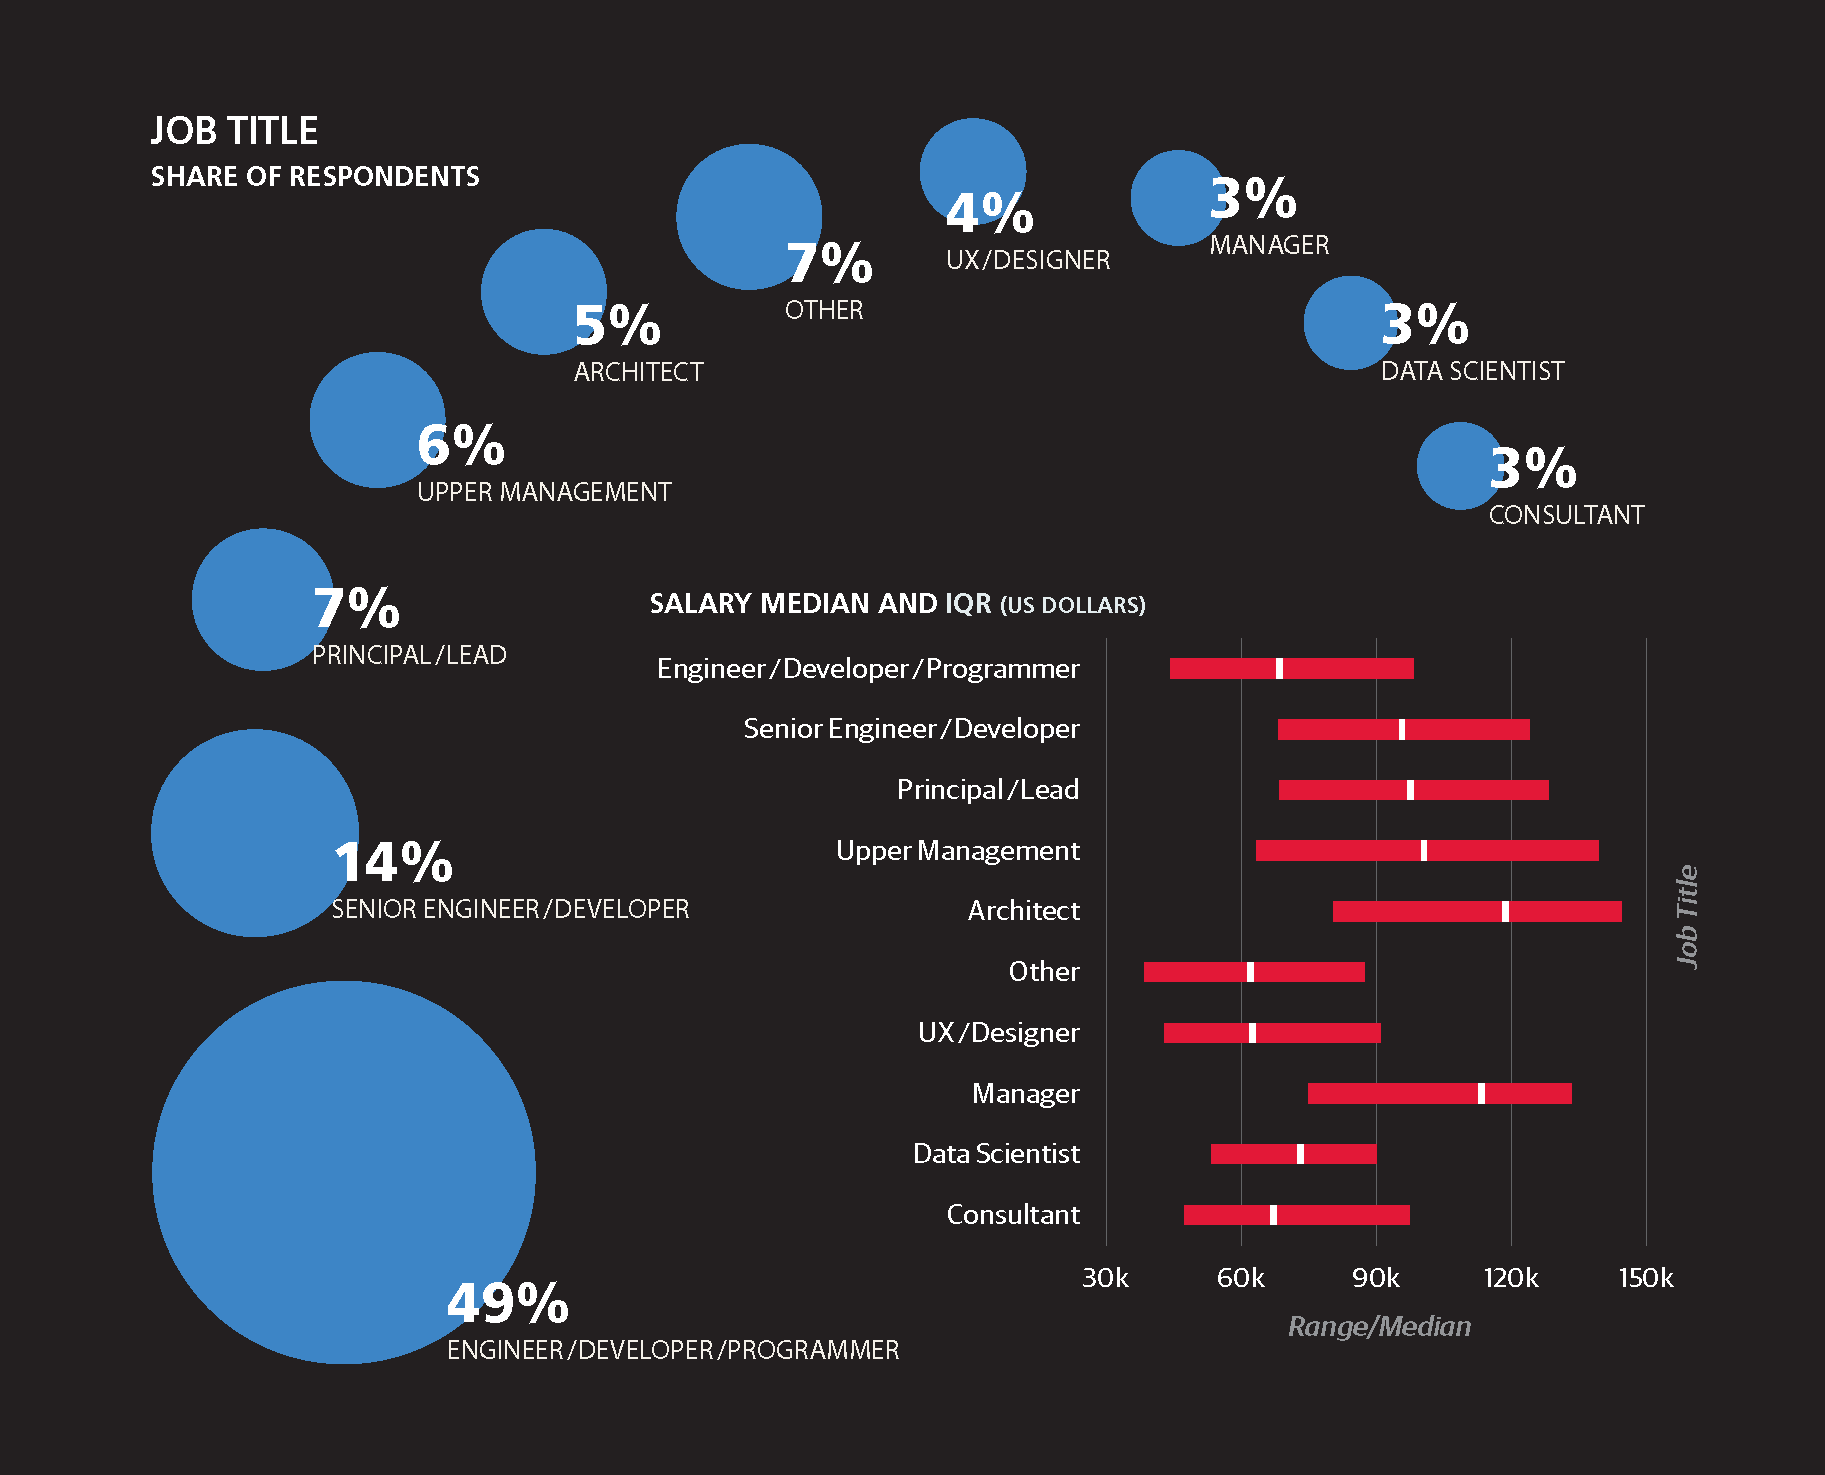
A MANAGER IN WEB DEVELOPMENT earns $11,689
more than other respondents, and upper management earns
$15,094 more. (We put a number of self-defined job categories
into “upper management:” CEO, president, owner, head
of engineering, VP, etc.) The next best career step is to ascend
to the rank of an architect, where you can earn $9,760 more.
Job titles and company sizes interact in our survey. In small
firms, we get responses from a relatively large number of people
whose jobs are in “upper management,” but salaries in
small companies are generally lower than those in large ones.
Correspondingly, people whose job titles say “architect” tend
to work for large firms, and benefit from that position.
Other bonuses and penalties added up as follows:
-
Senior engineer/developer: $4,311 better than average
-
Principal/lead: $1,896 better than average
-
System administrator: $2,636 worse than average
-
Engineer/developer/programmer: $3,243 worse
than average
And among these job descriptions, consultants again come
out the big losers: $6,547 worse than average.
Hours Worked
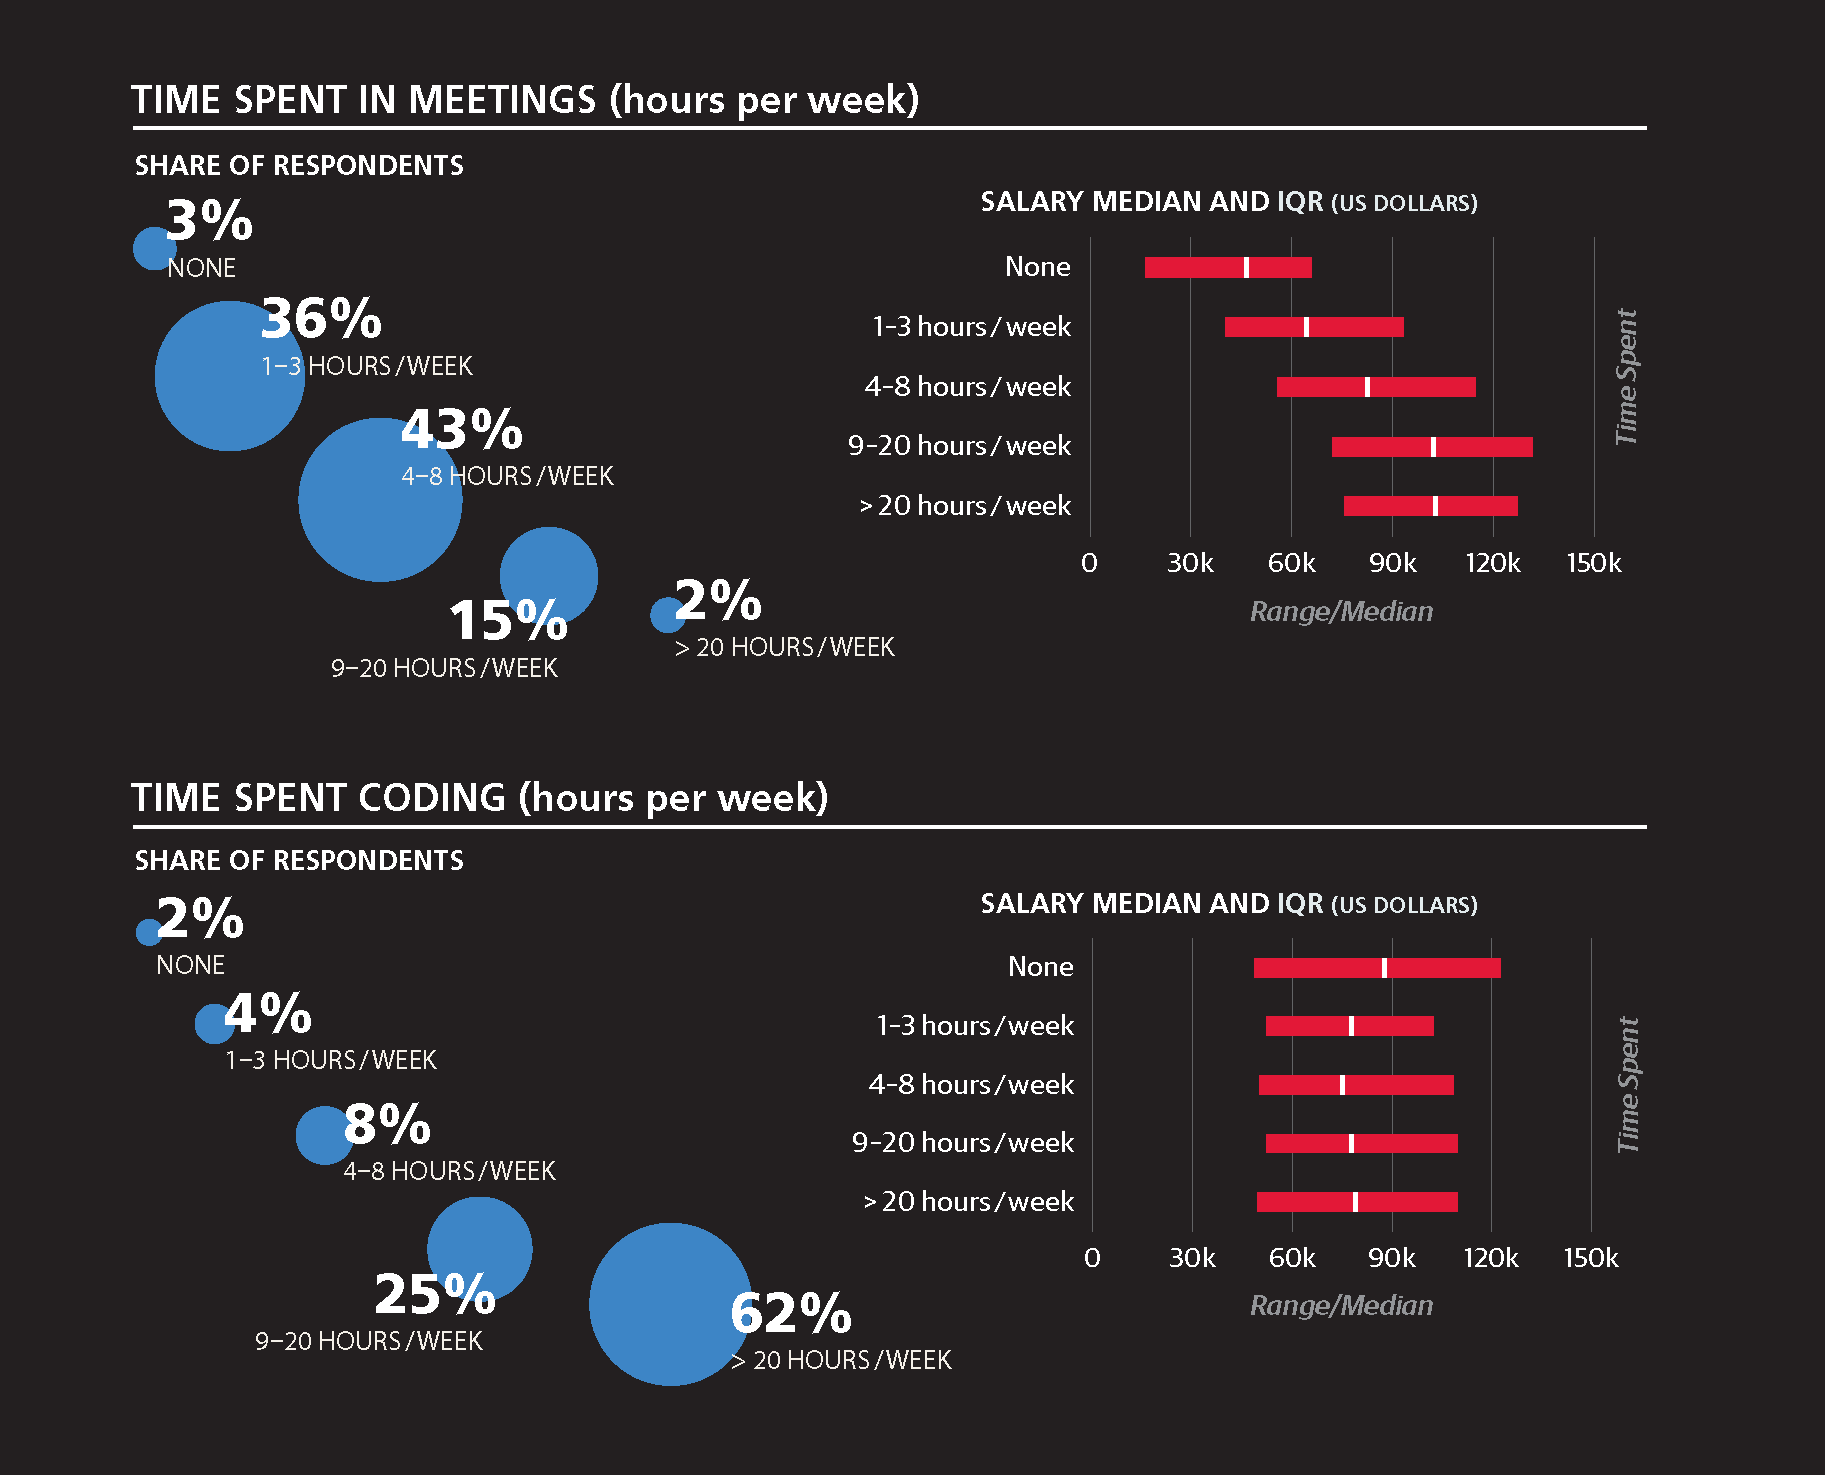
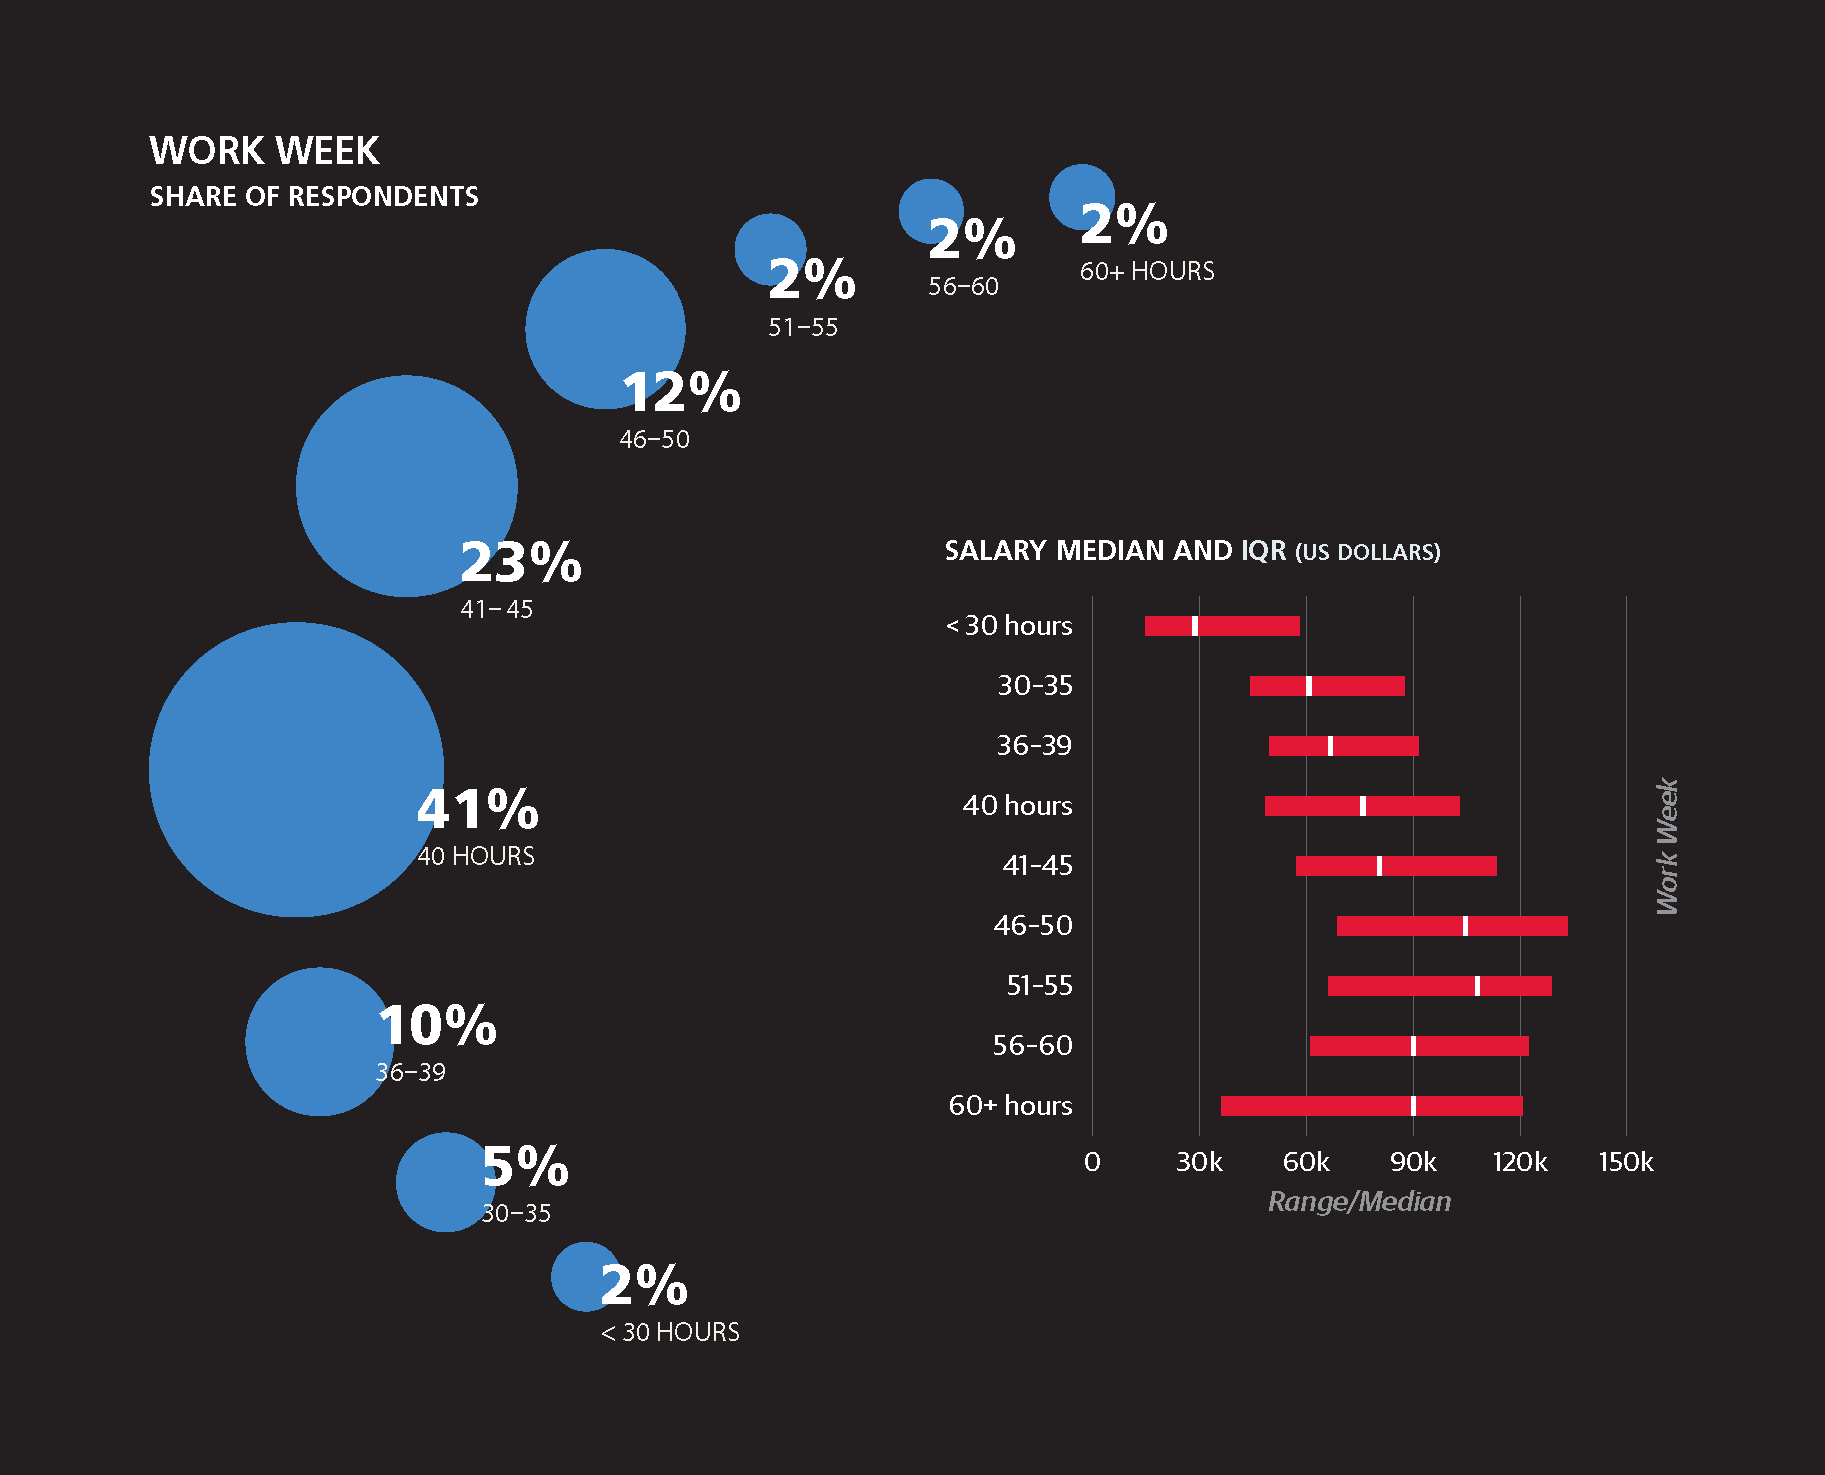
On the web, workaholics rule. You get an enormous advantage
over other employees for working more than 60 hours a
week. In general, the more hours you work, the better your
salary, but the 60+ bonus of $14,199 stood out. (We did not
calculate what people earn by the hour.)
Activities
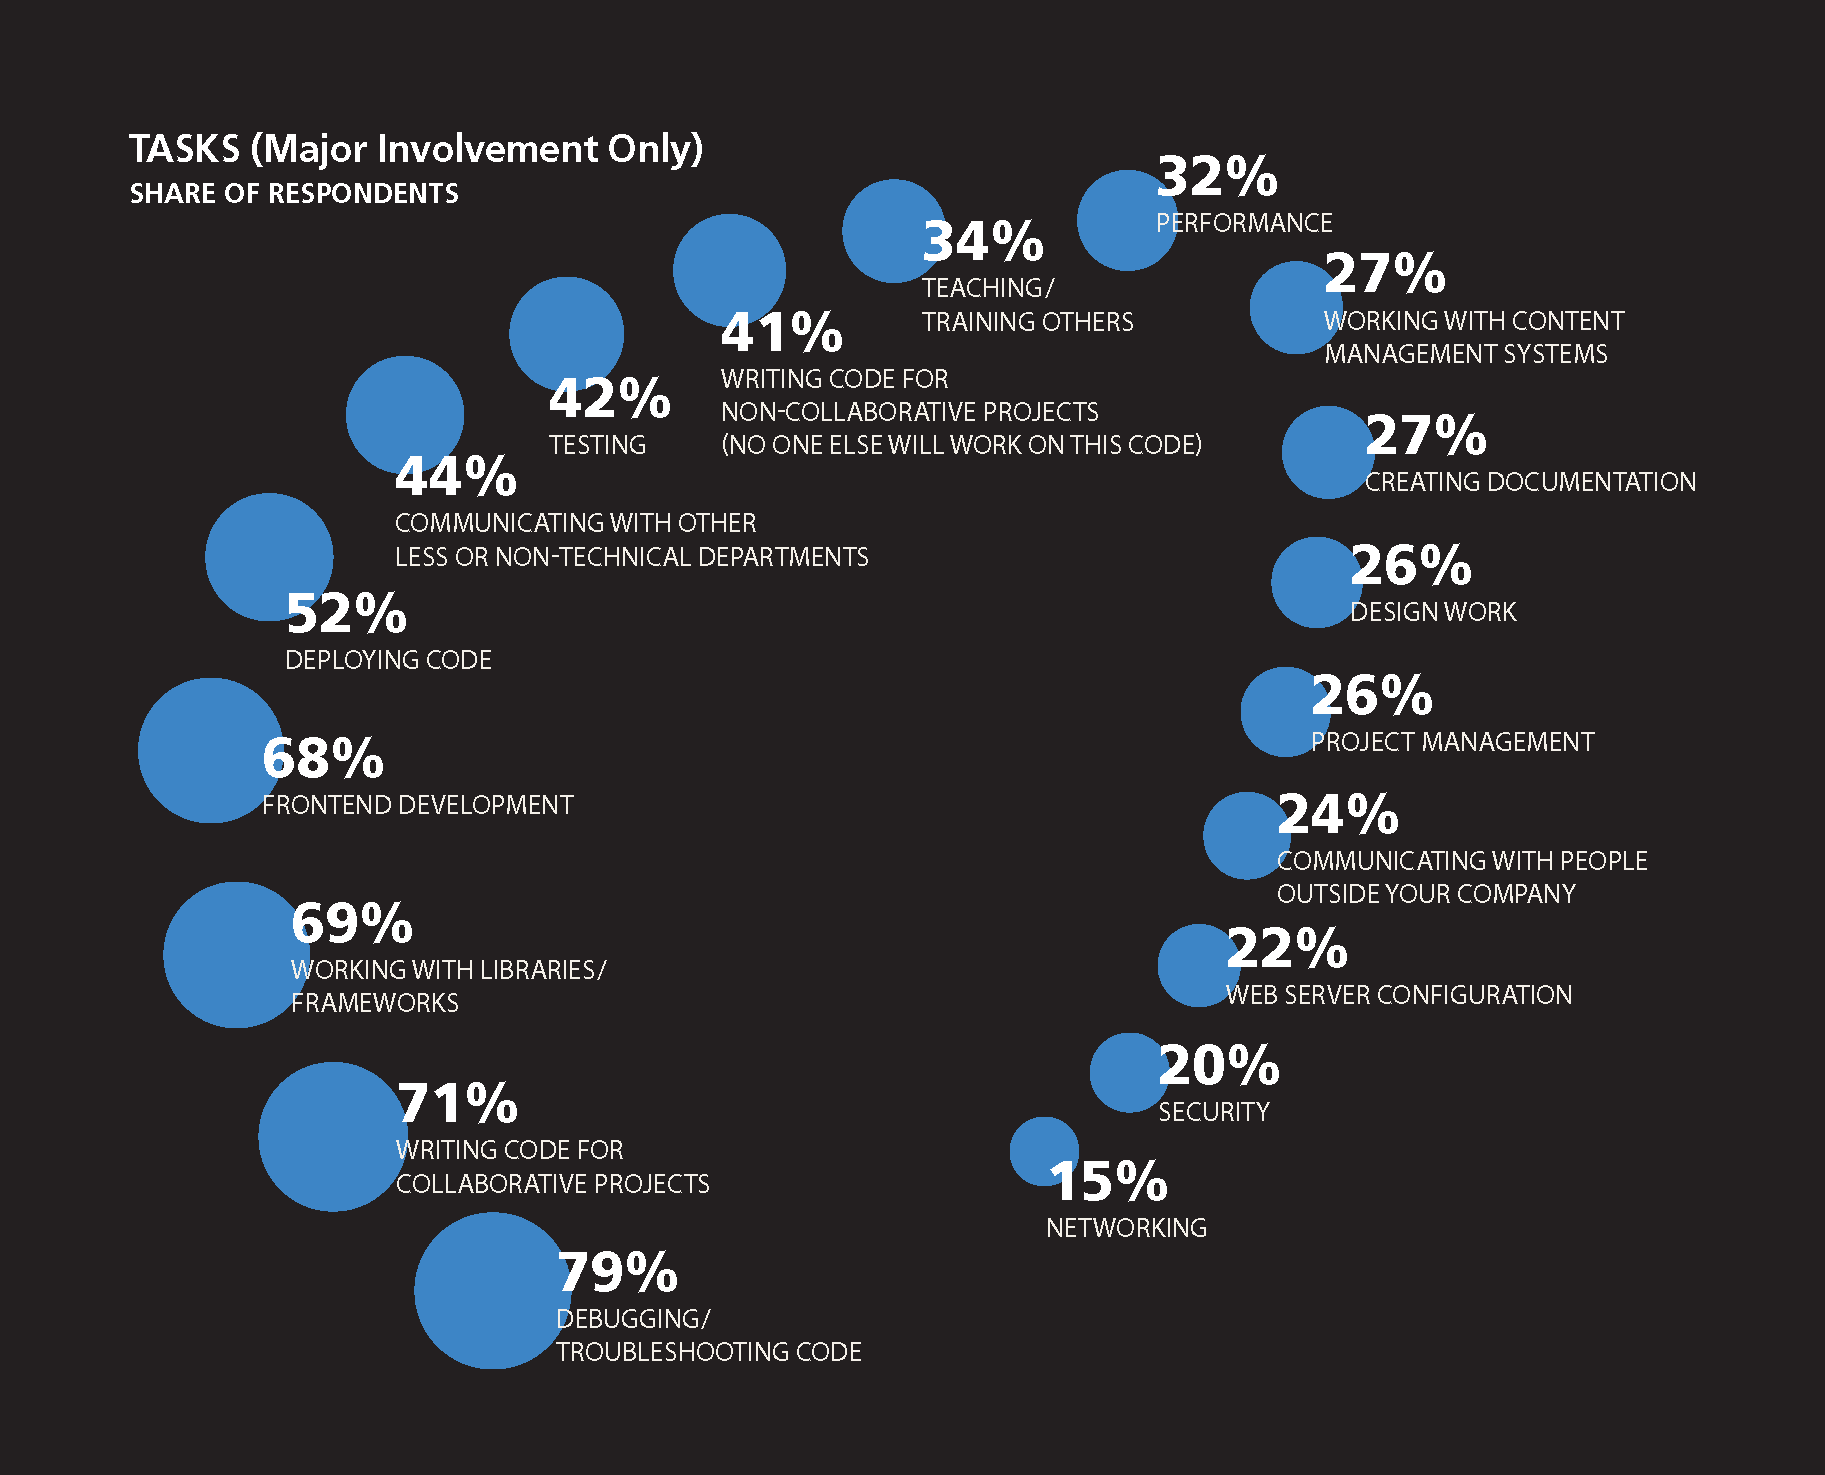
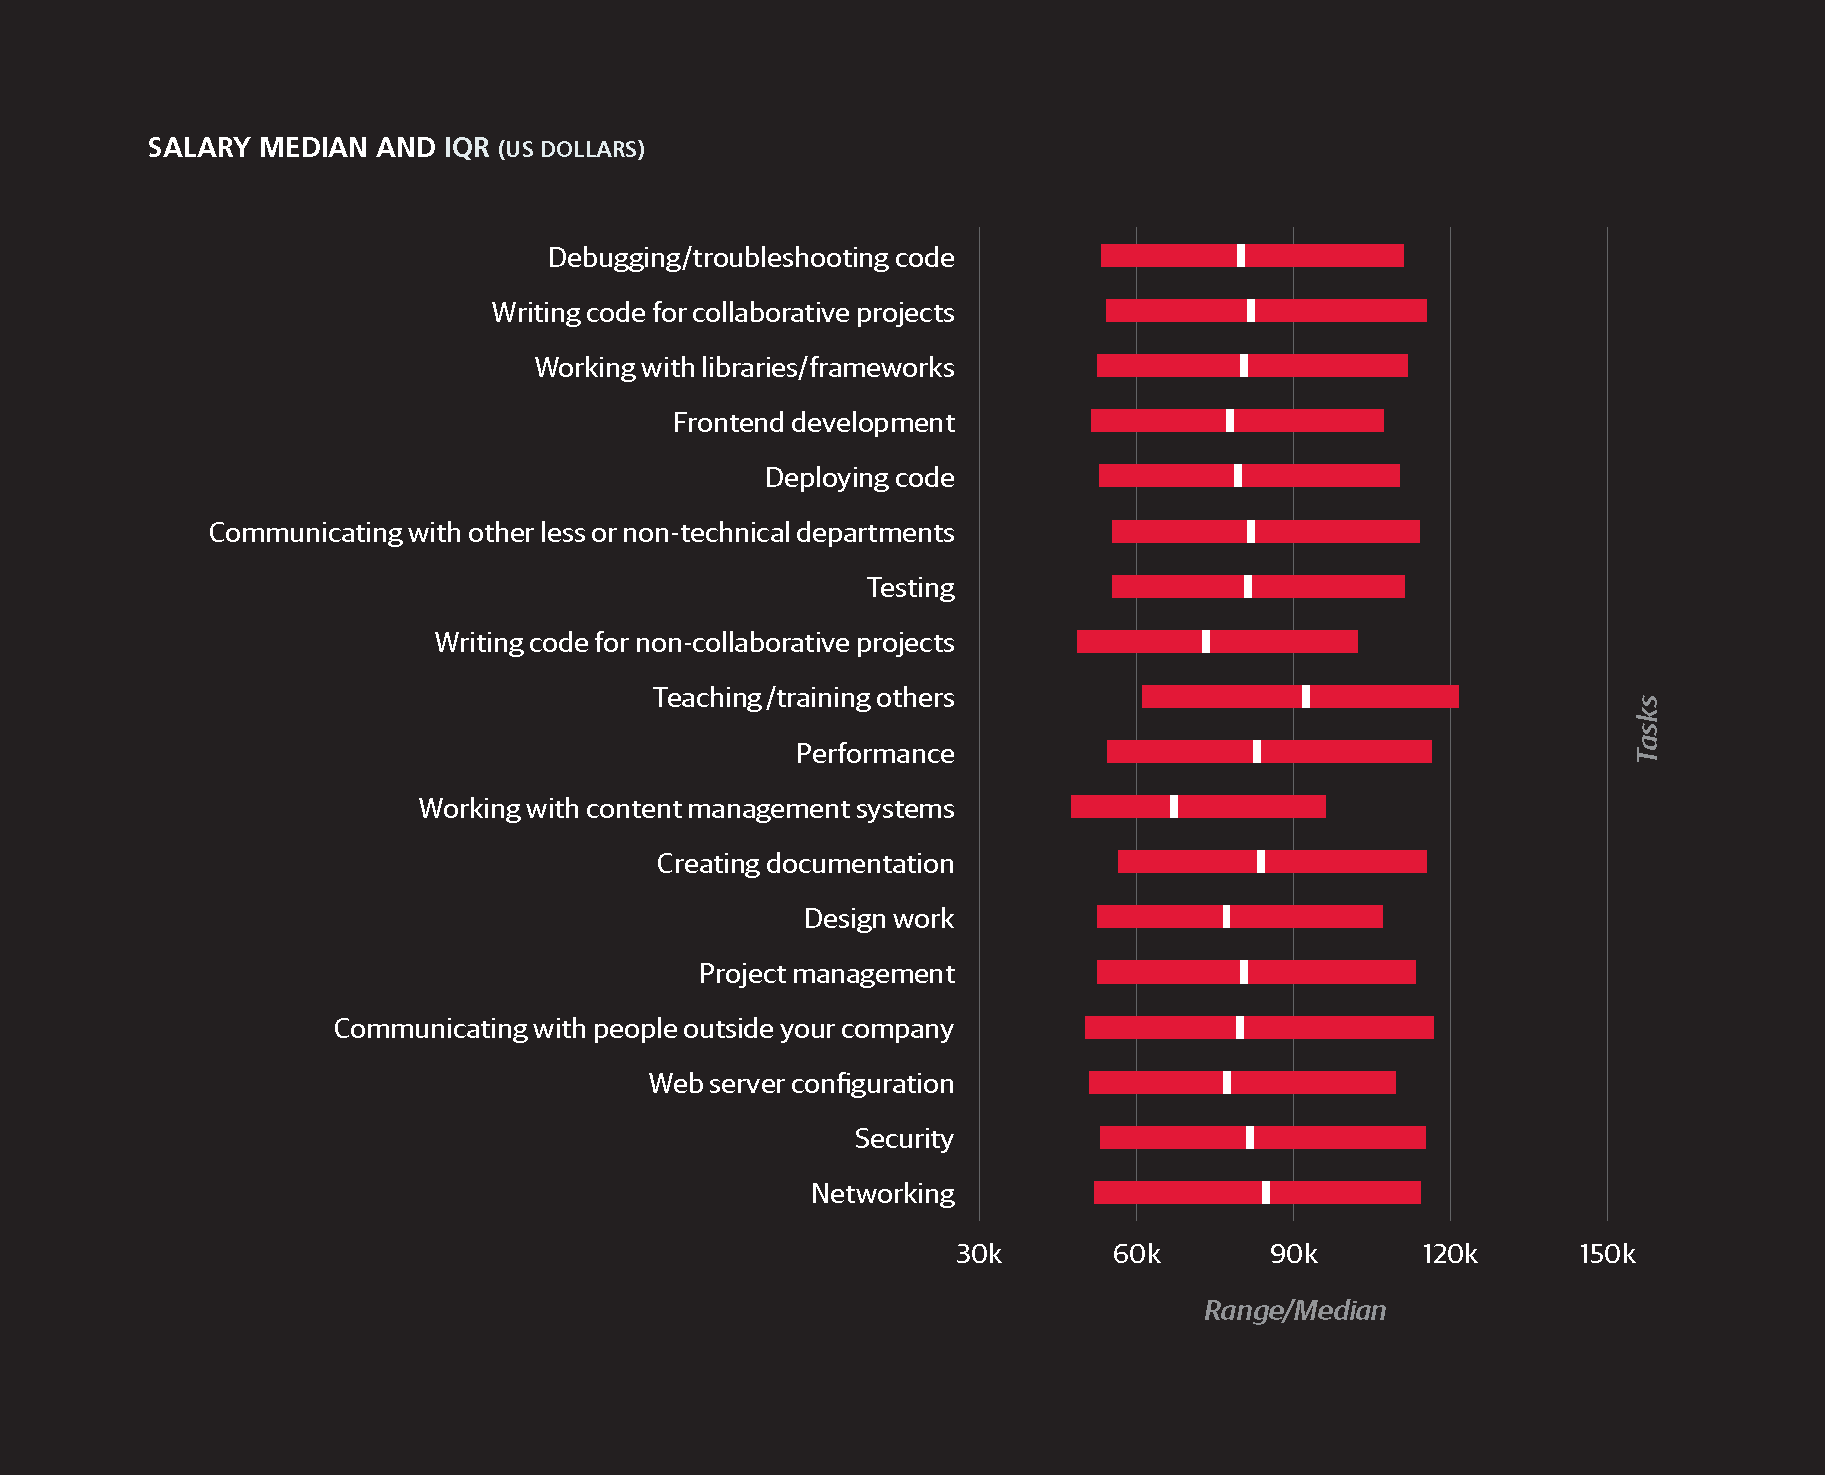
Writing code for collaborative projects proved to be a good
investment. Respondents who reported “minor involvement”
in collaborative projects saw a bonus $3,485, while “major
involvement” reaped a bonus of $5,093.
We tried to measure the effects of different tasks. Attending
meetings is correlated with significant salary increases.
This doesn’t mean you should arrange to attend arbitrary
meetings. The statistics are probably associated with playing a
role of team leader or manager. Interestingly, more meetings
are not necessarily better—there’s a limit to the benefit. Here
are the correlations:
-
4 to 8 hours of meetings per week: $3,873 better
-
9 to 20 hours of meetings per week: $6,961 better
-
More than 20 hours of meetings per week: $2,309 better
Teaching or training others also has a positive effect. All other
things being equal, you earn $2,300 more by being involved
in teaching.
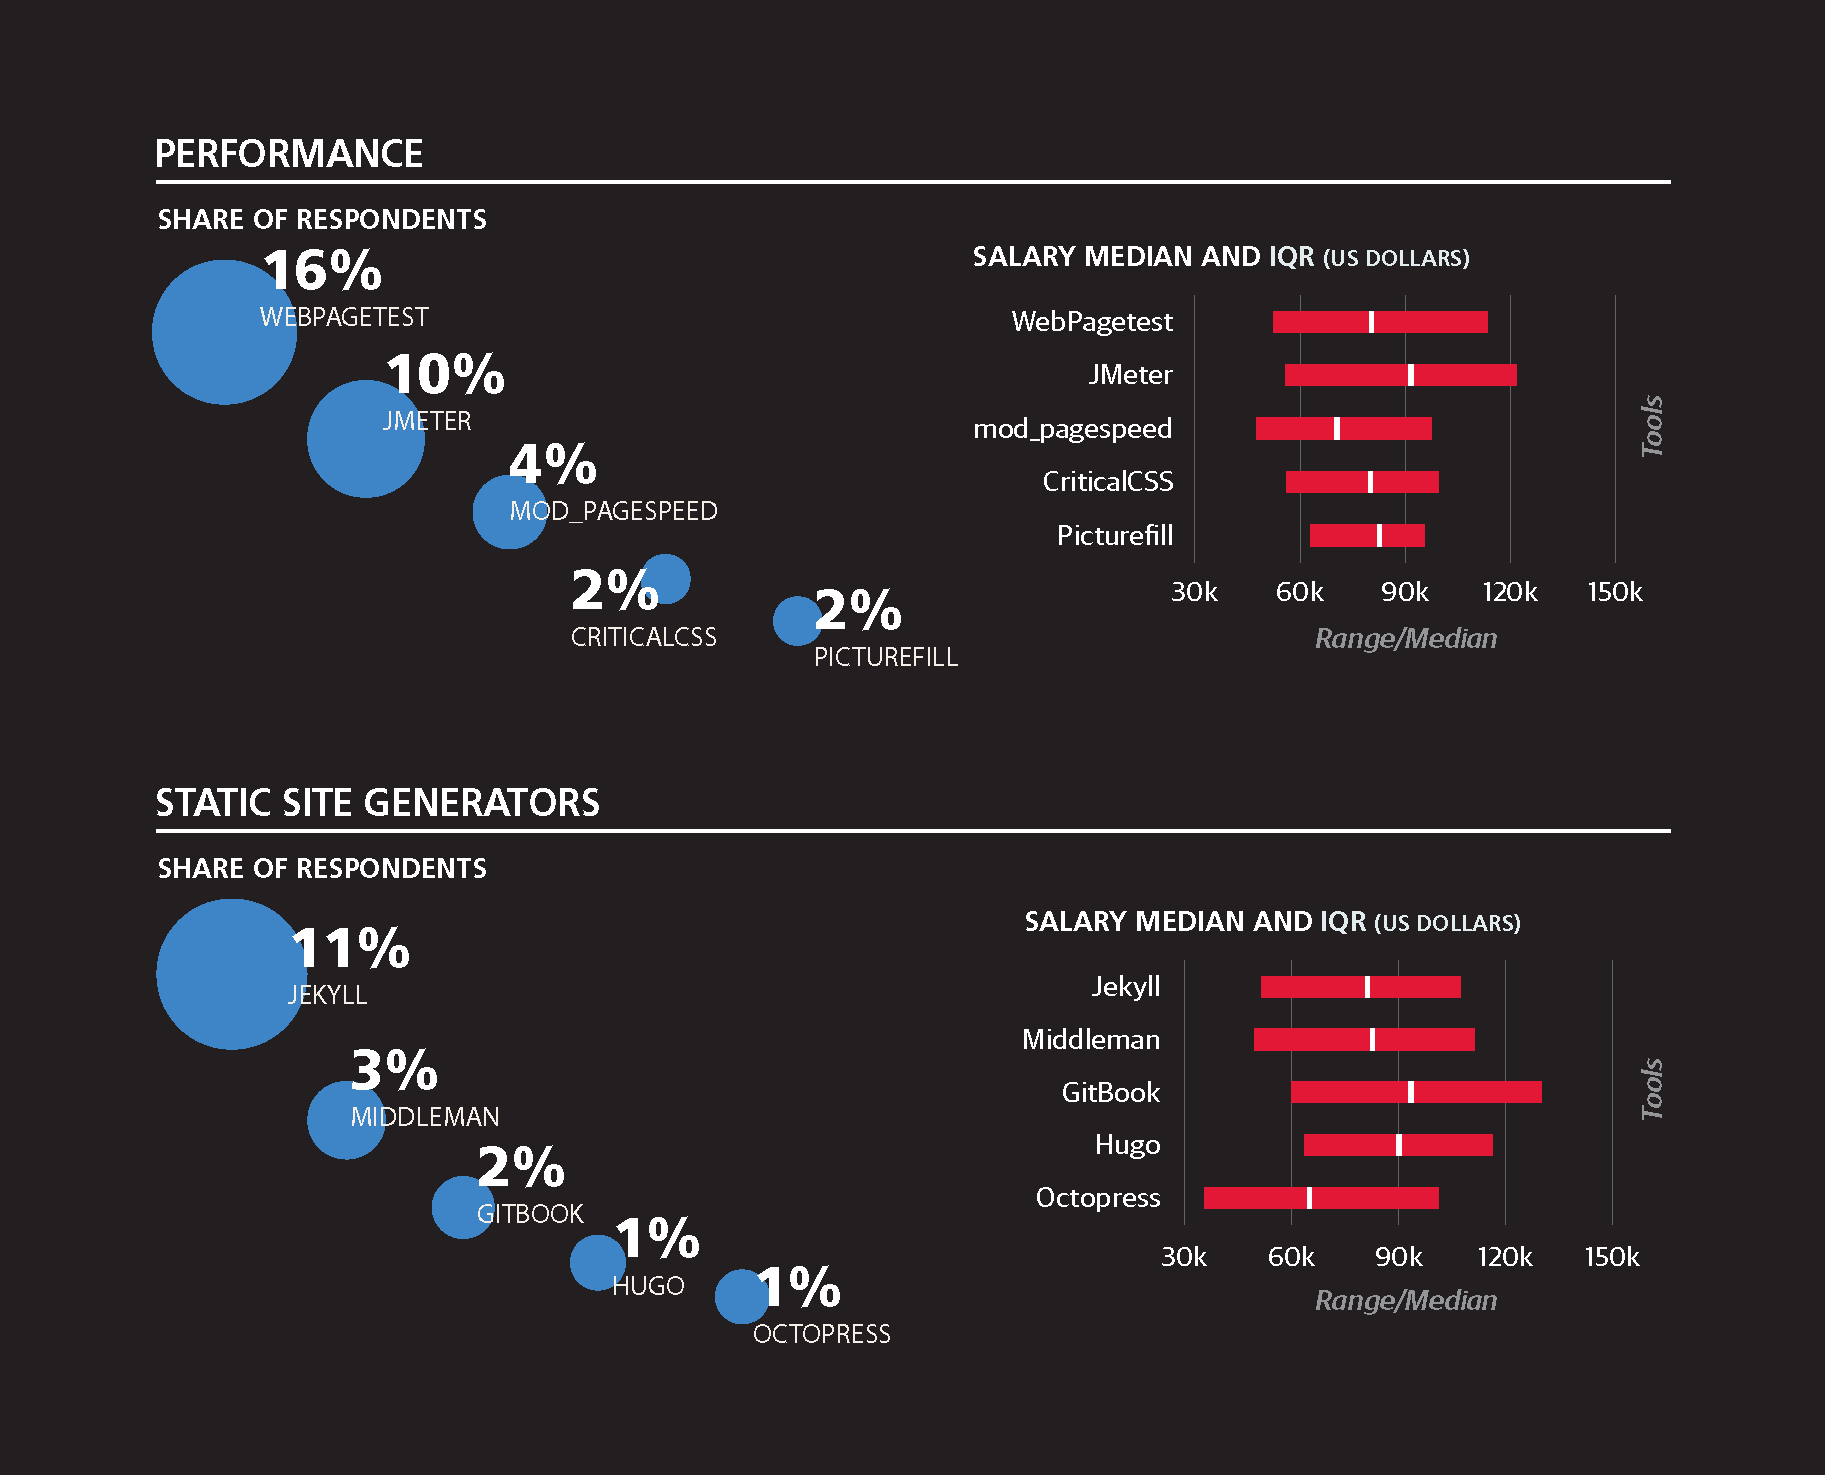
Performance is a good field to enter: you earn $1,434 more
than average for minor involvement in performance and
$2,258 more than average for major involvement.
The tasks you do want to avoid are project management and
content management systems. Major involvement in project
management, oddly enough, brings with it a $3,476 decrease
in salary, although minor involvement has no effect. Similarly,
you are penalized $1,476 if you have major involvement in
communicating with less technical or non-technical departments
(but no penalty for minor involvement).
Minor involvement with CMSs costs you $4,647, and major
involvement costs you only $3,824. We don’t know why
major involvement should be better than minor involvement.
The reason may be that CMSs are associated with less technically
sophisticated jobs.
Designers get less money than average; they do not measure
up to programmers in salary. Minor involvement in design
work earns $1,244 less than average, and major involvement
earns $1,094 less than average.
Tools, Languages, and Platforms
THE RAW TALLIES OF RESPONDENTS’ ANSWERS furnished
a few interesting insights.
-
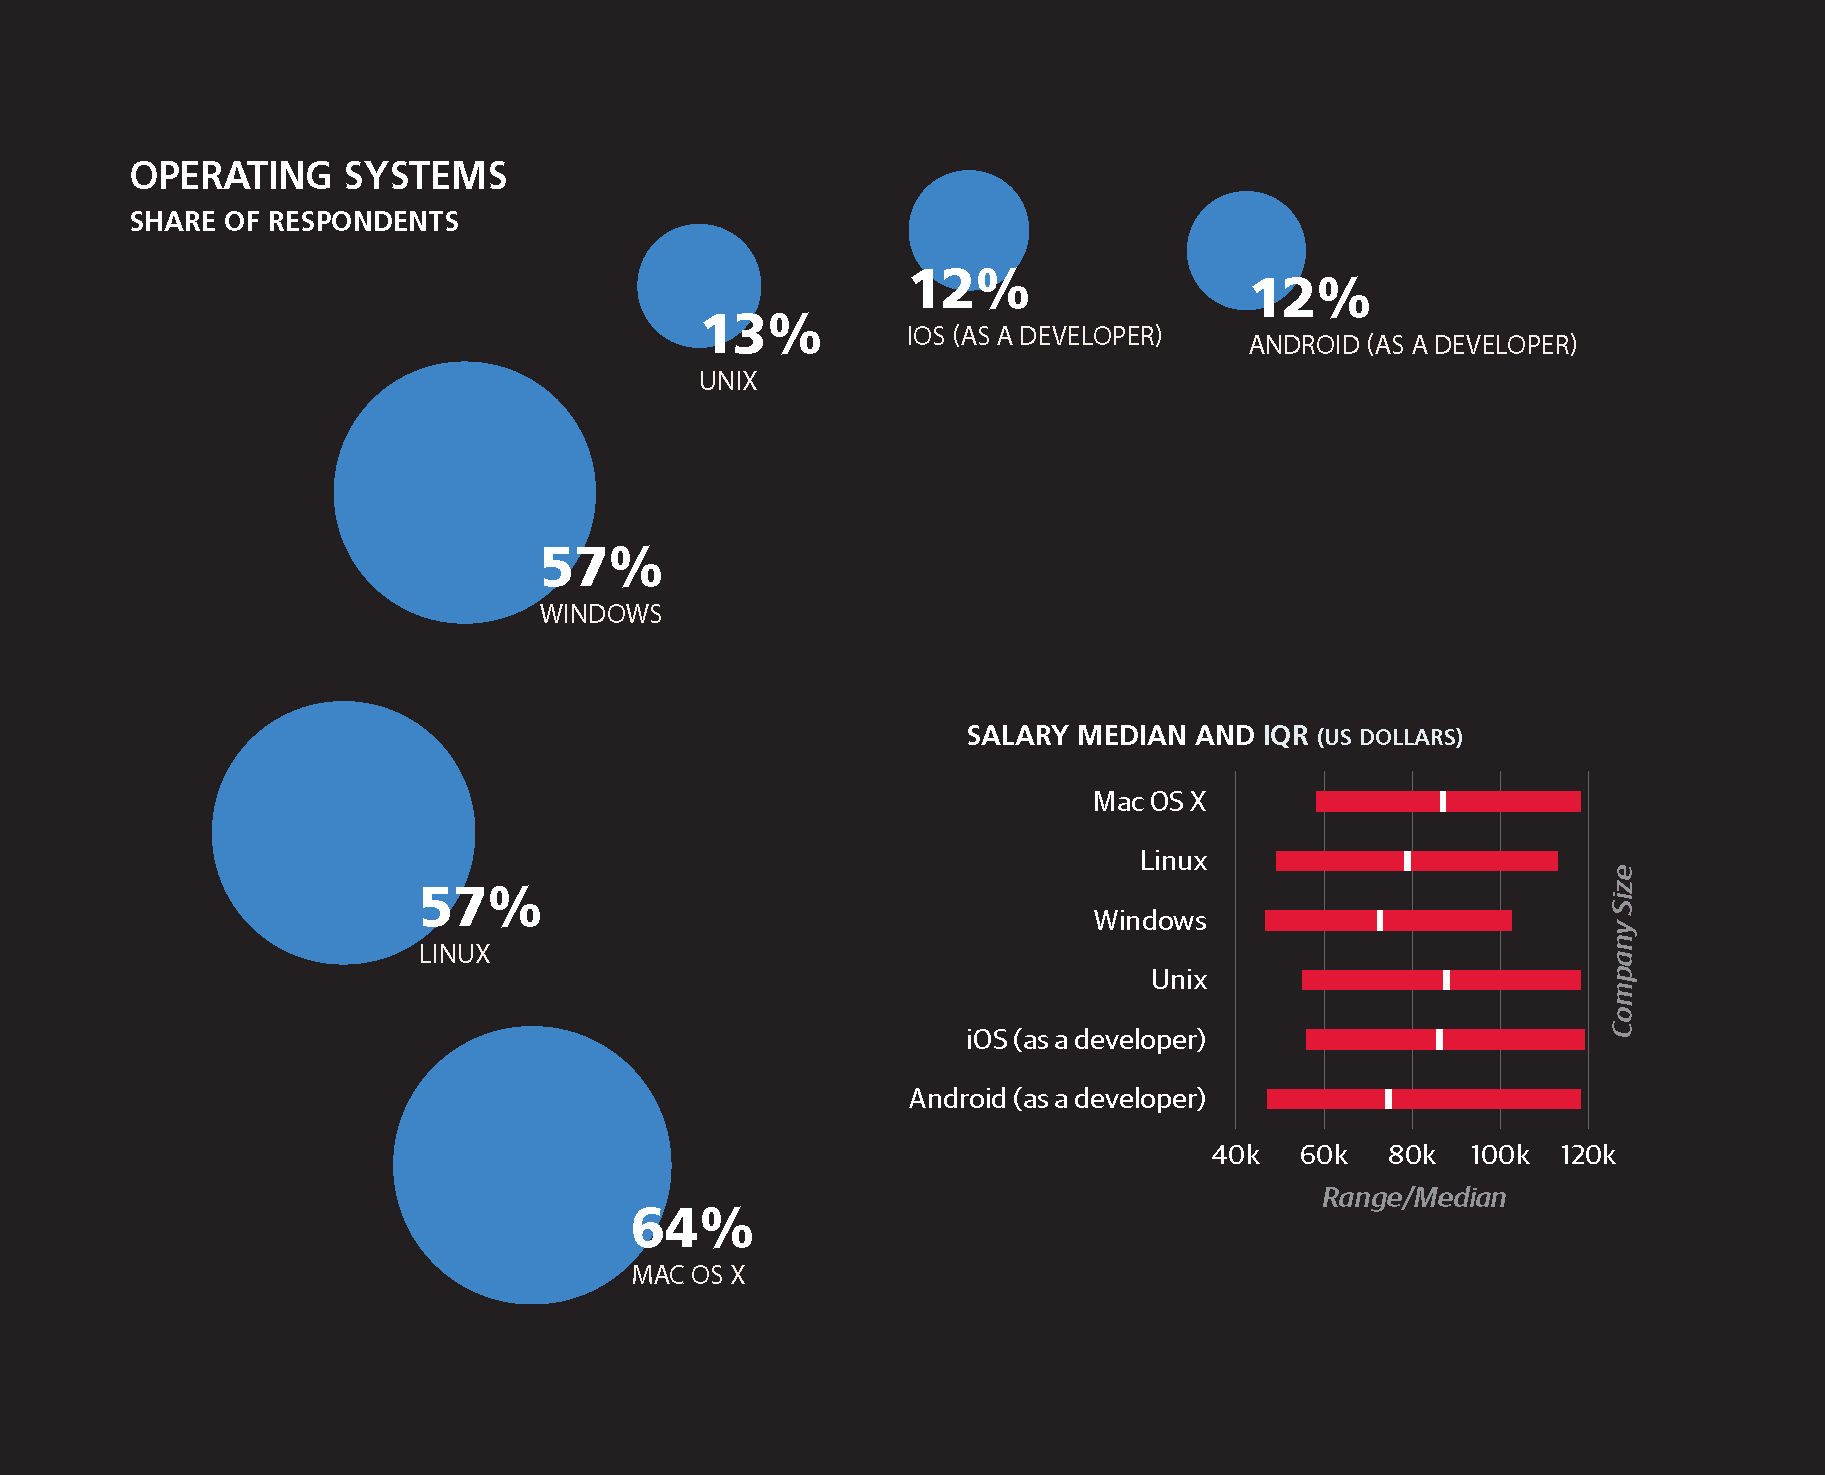
MacOS is the most popular operating system, used by
64% of respondents, but Linux is also surprisingly popular
at 57%. (Respondents obviously use multiple computers,
because the shares of operating systems add up to much
more than 100%.) -
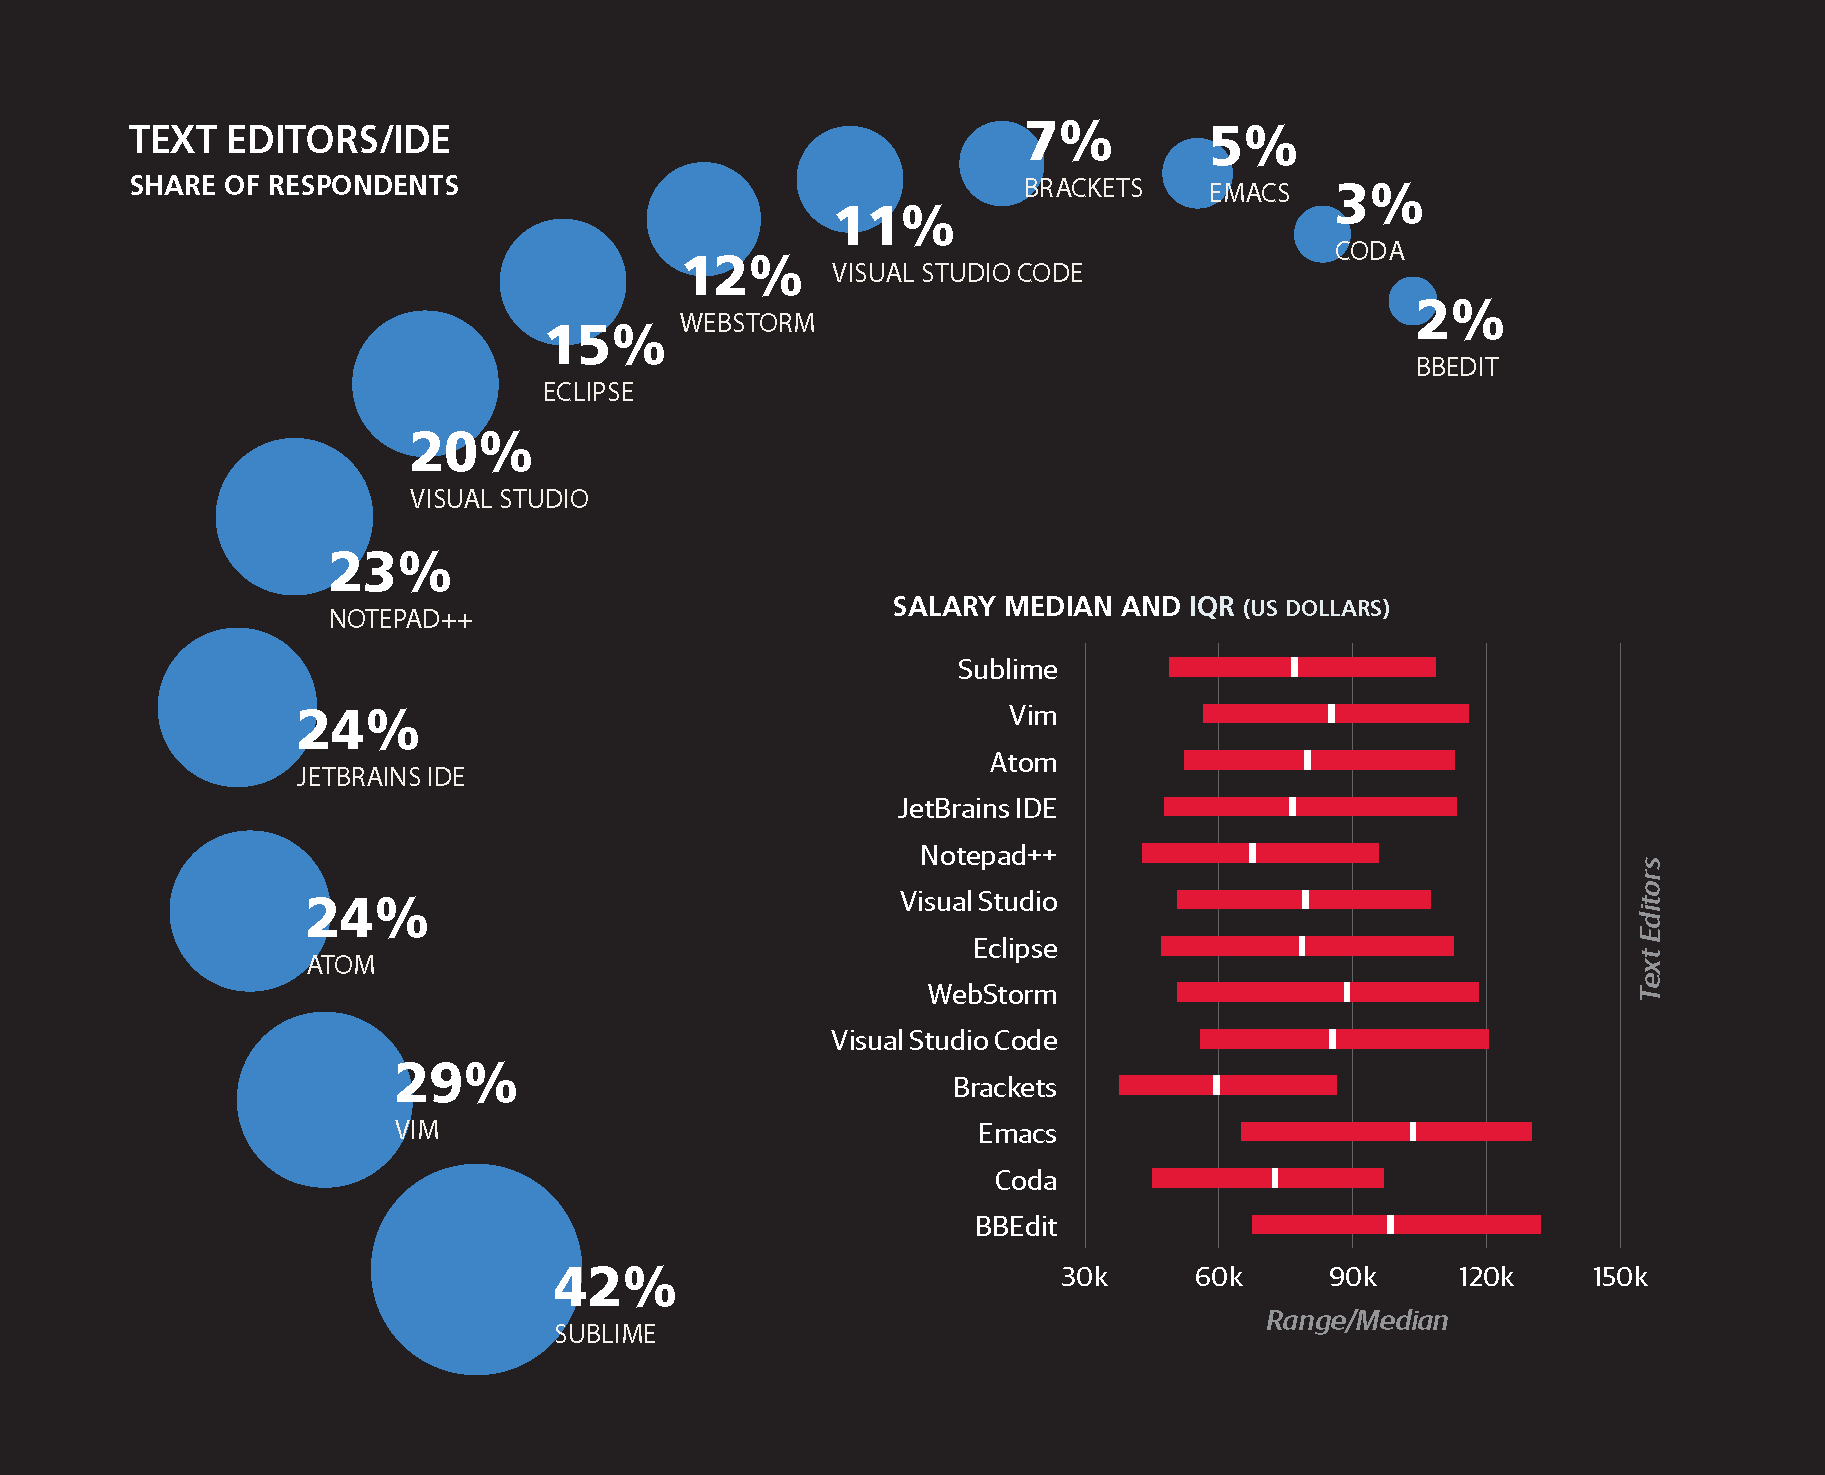
Sublime is a surprising favorite for text editors, chosen
by 42% of the respondents (although once again, totals
added up to more than 100%. -
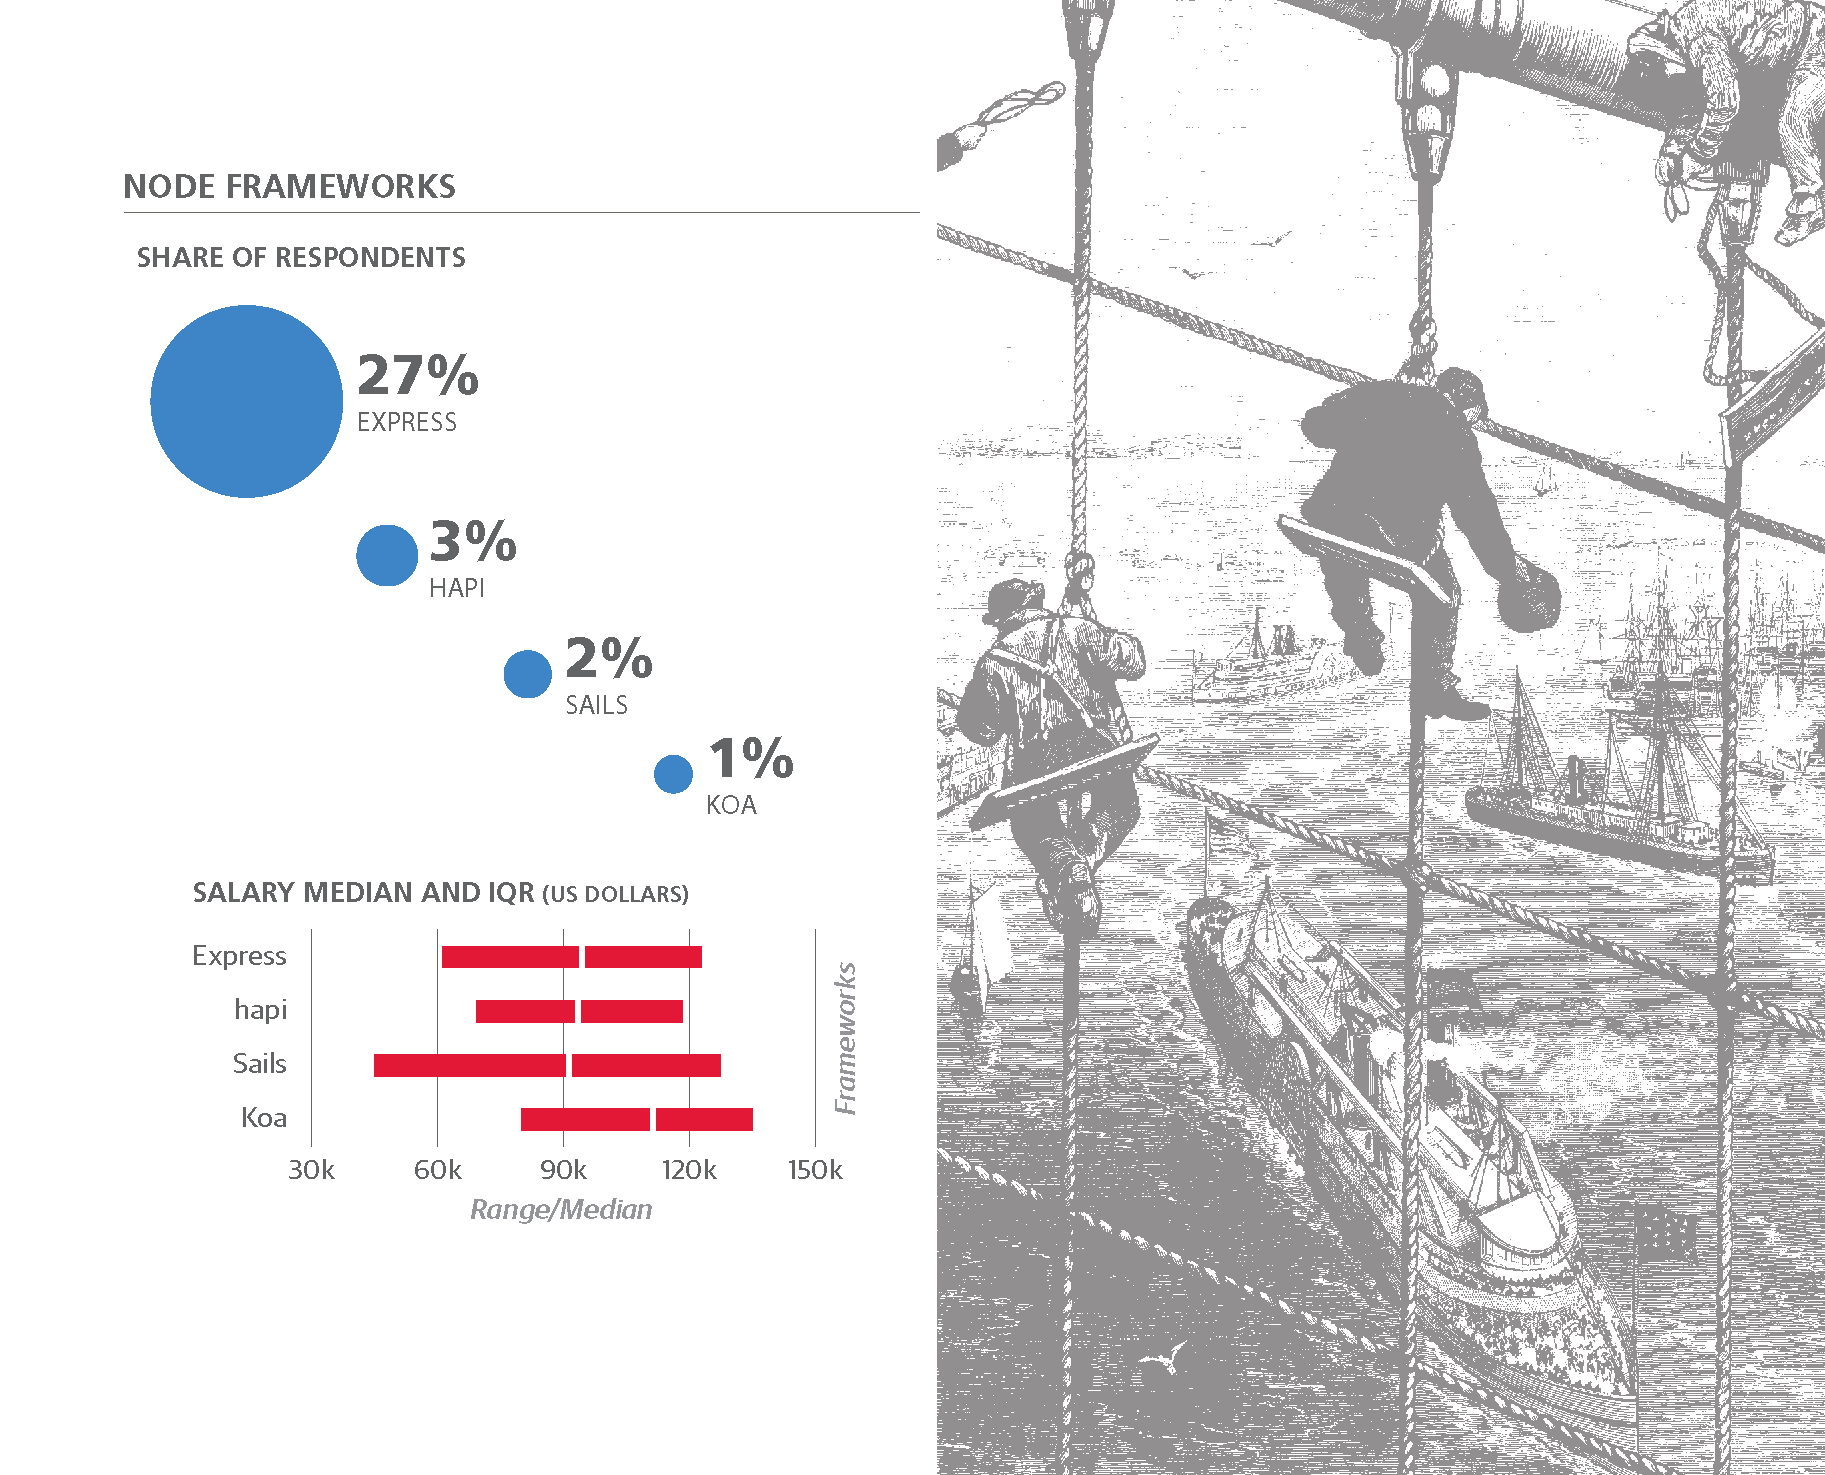
Express runs away with the prize for most popular
Node framework. It was chosen by 26% of all survey
respondents, whereas hapi, Koa, and Sails each got just
1% to 3%. -
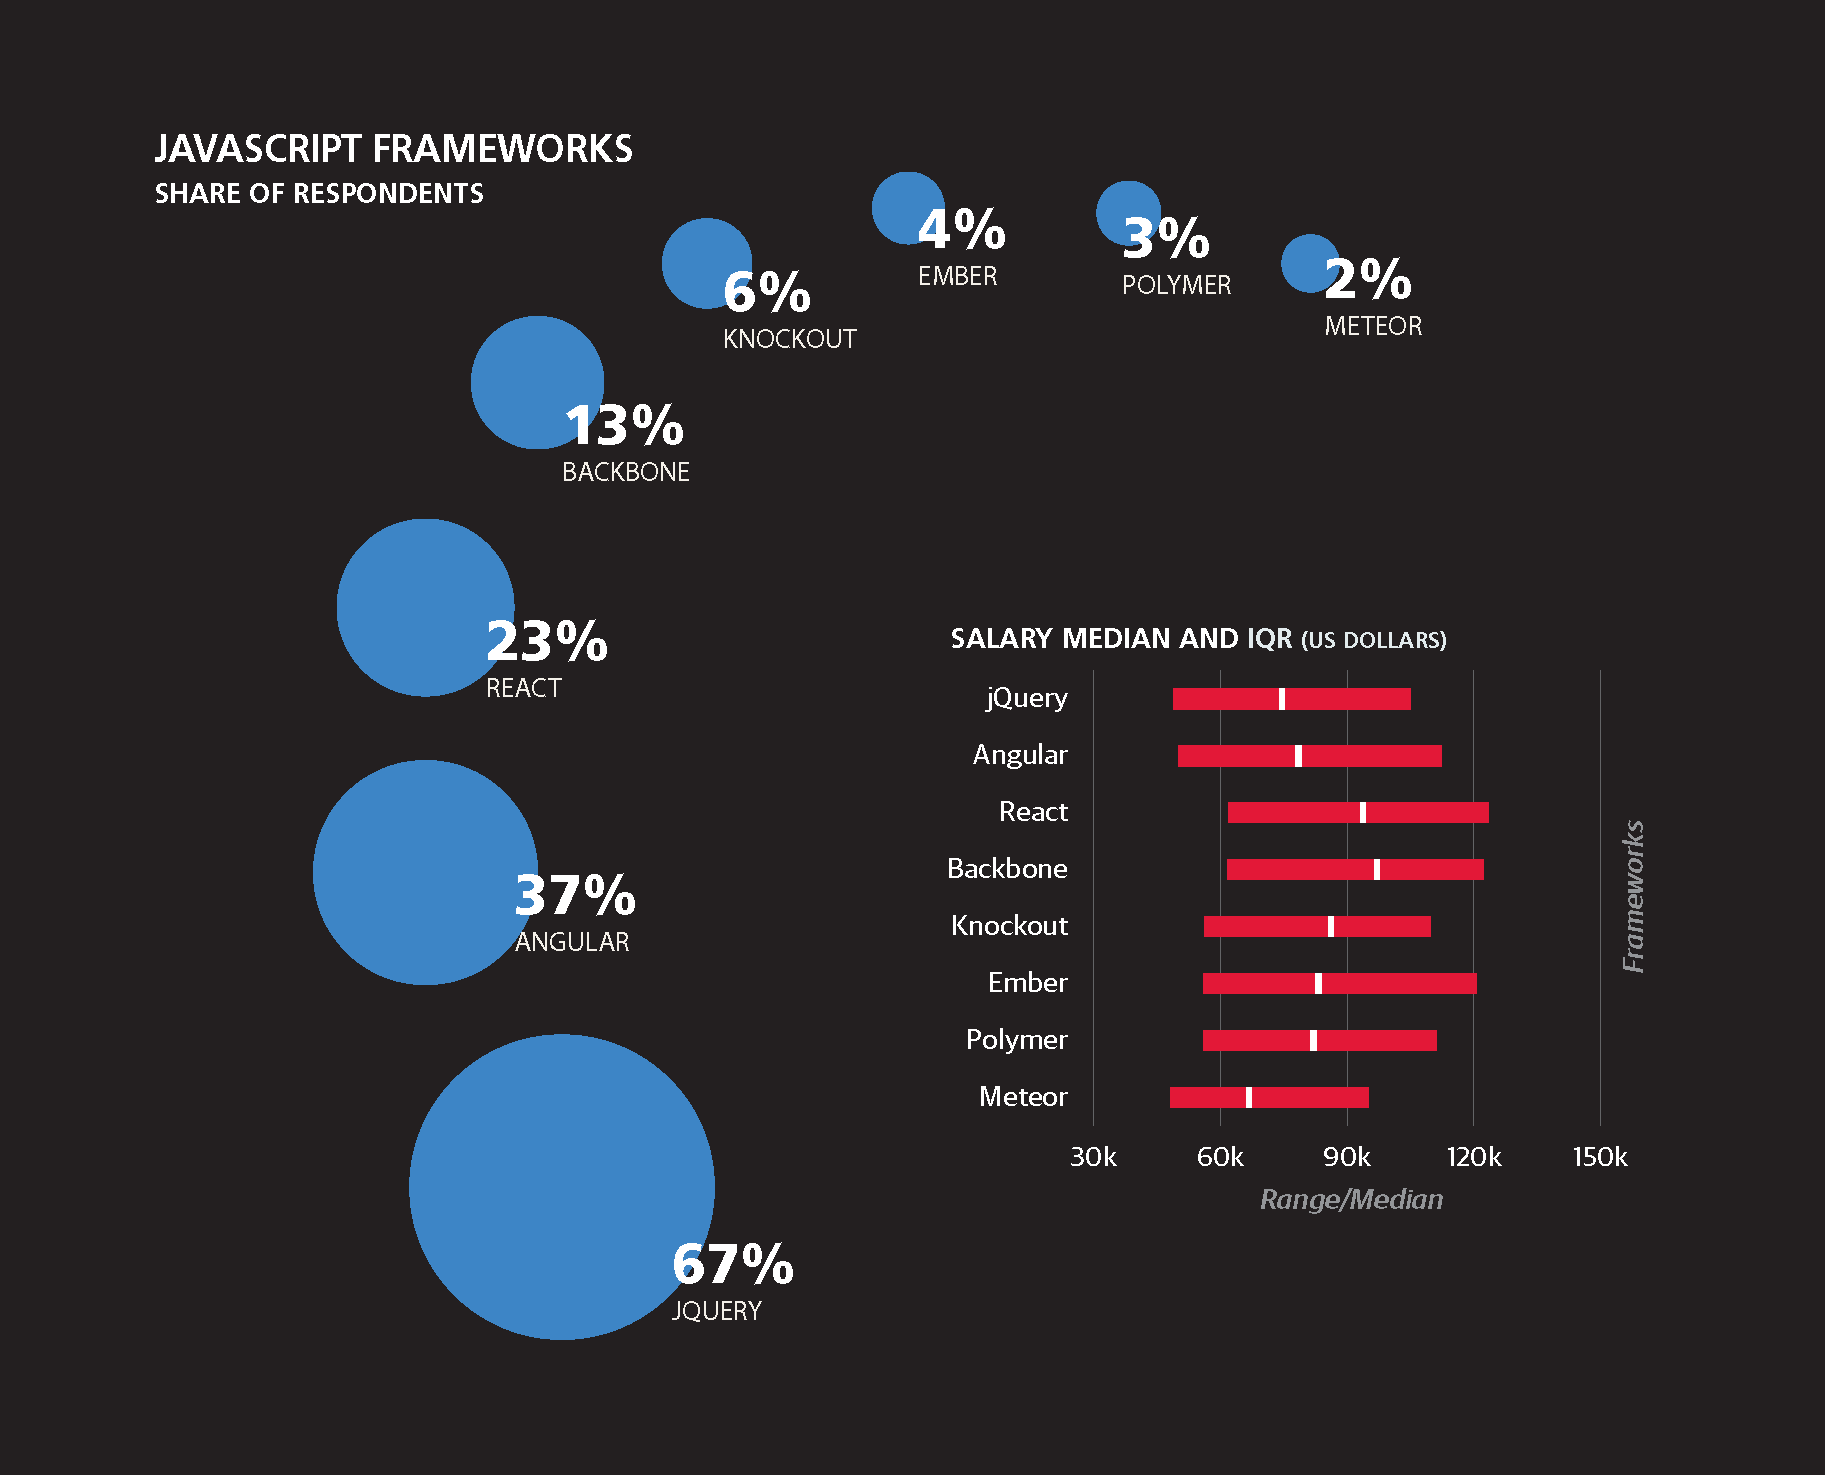
Familiar JavaScript frameworks turned up as favorites,
although Backbone came out further down the list:-
jQuery: 67%
-
Angular: 37%
-
React: 23%
-
Backbone: 13%
-
Knockout: 6%
-
Ember: 4%
-
Polymer: 3%
-
Meteor: 2%
-
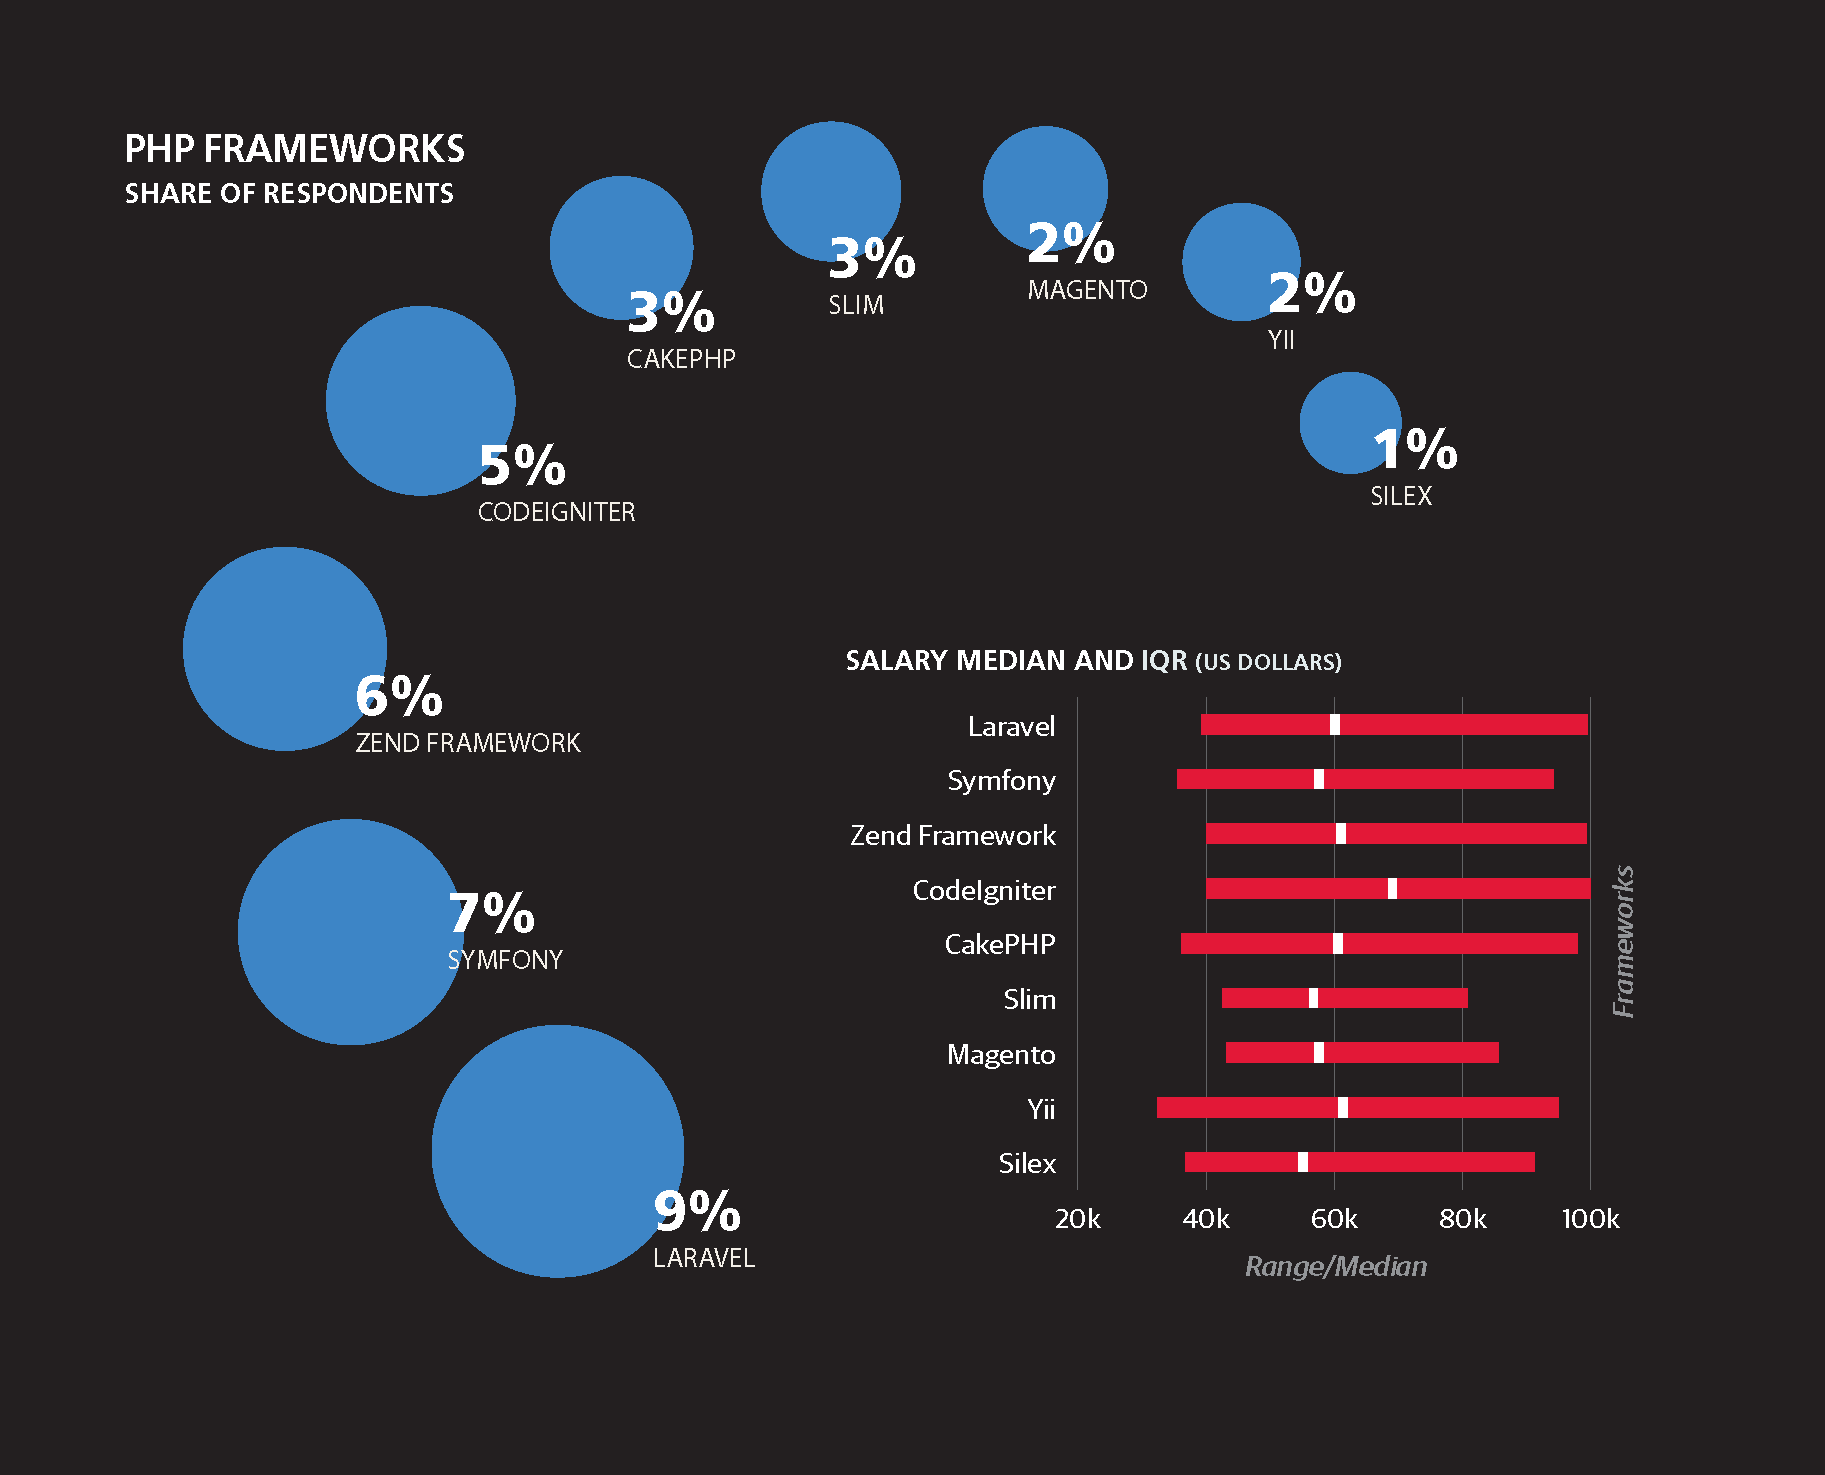
There was no such rush toward any PHP framework;
nine different frameworks took less than 10% each of
the respondents.
-
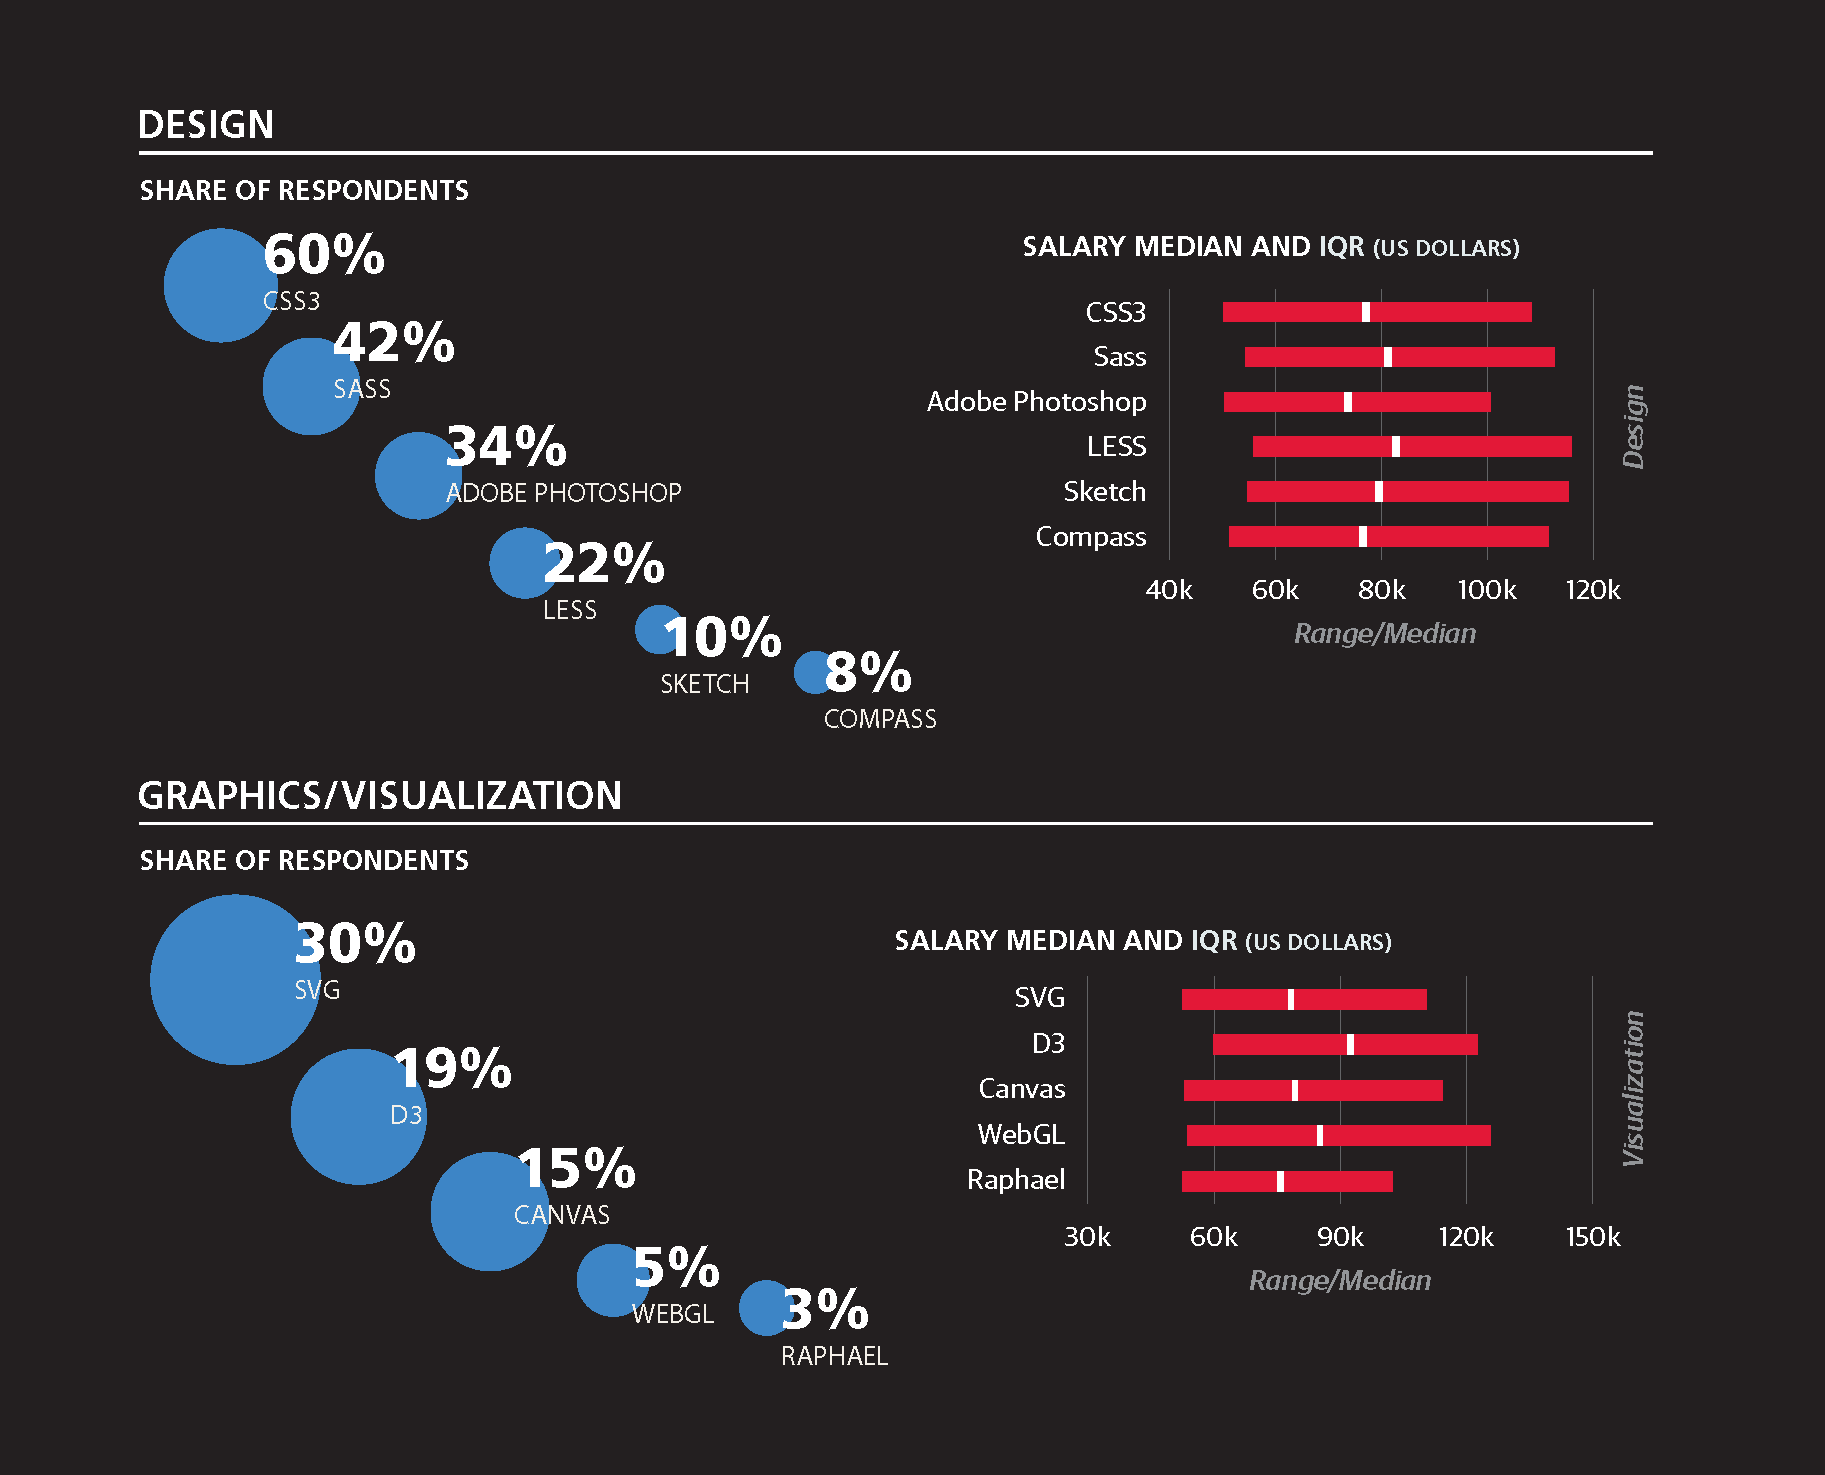
SVG is the most popular graphics environment but is still
relatively little used at 30%. D3 was even less popular, at
19%. -
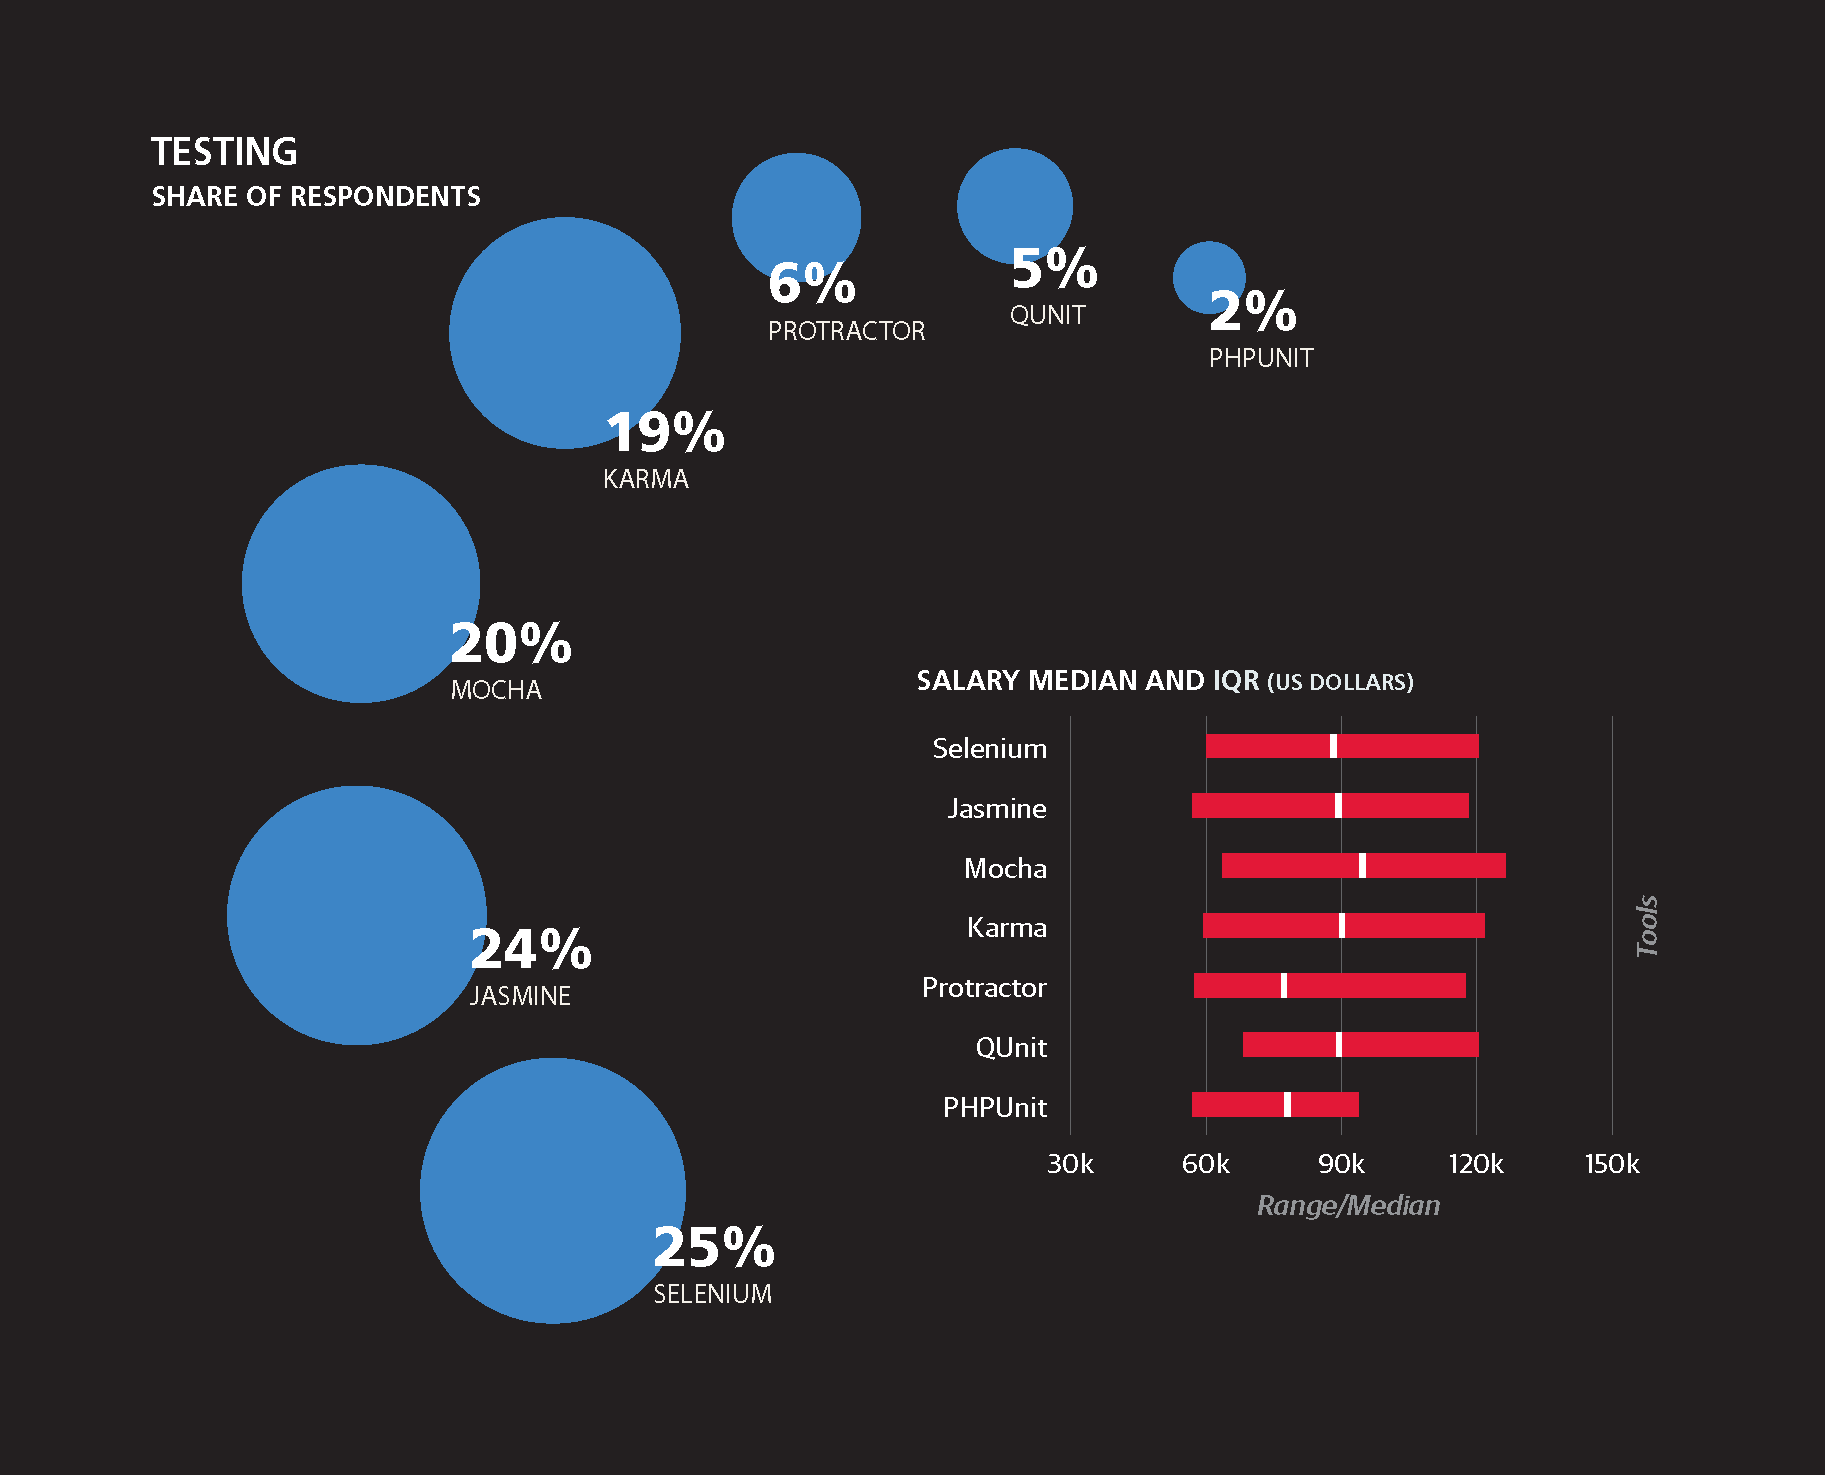
Selenium, at 25%, is the most popular testing tool,
as might be expected. However, there were other
strong contenders:-
Mocha: 20%
-
Karma: 19%
-
Protractor: 6%
-
QUnit: 5%
-
PHPUnit: 2%
-
-
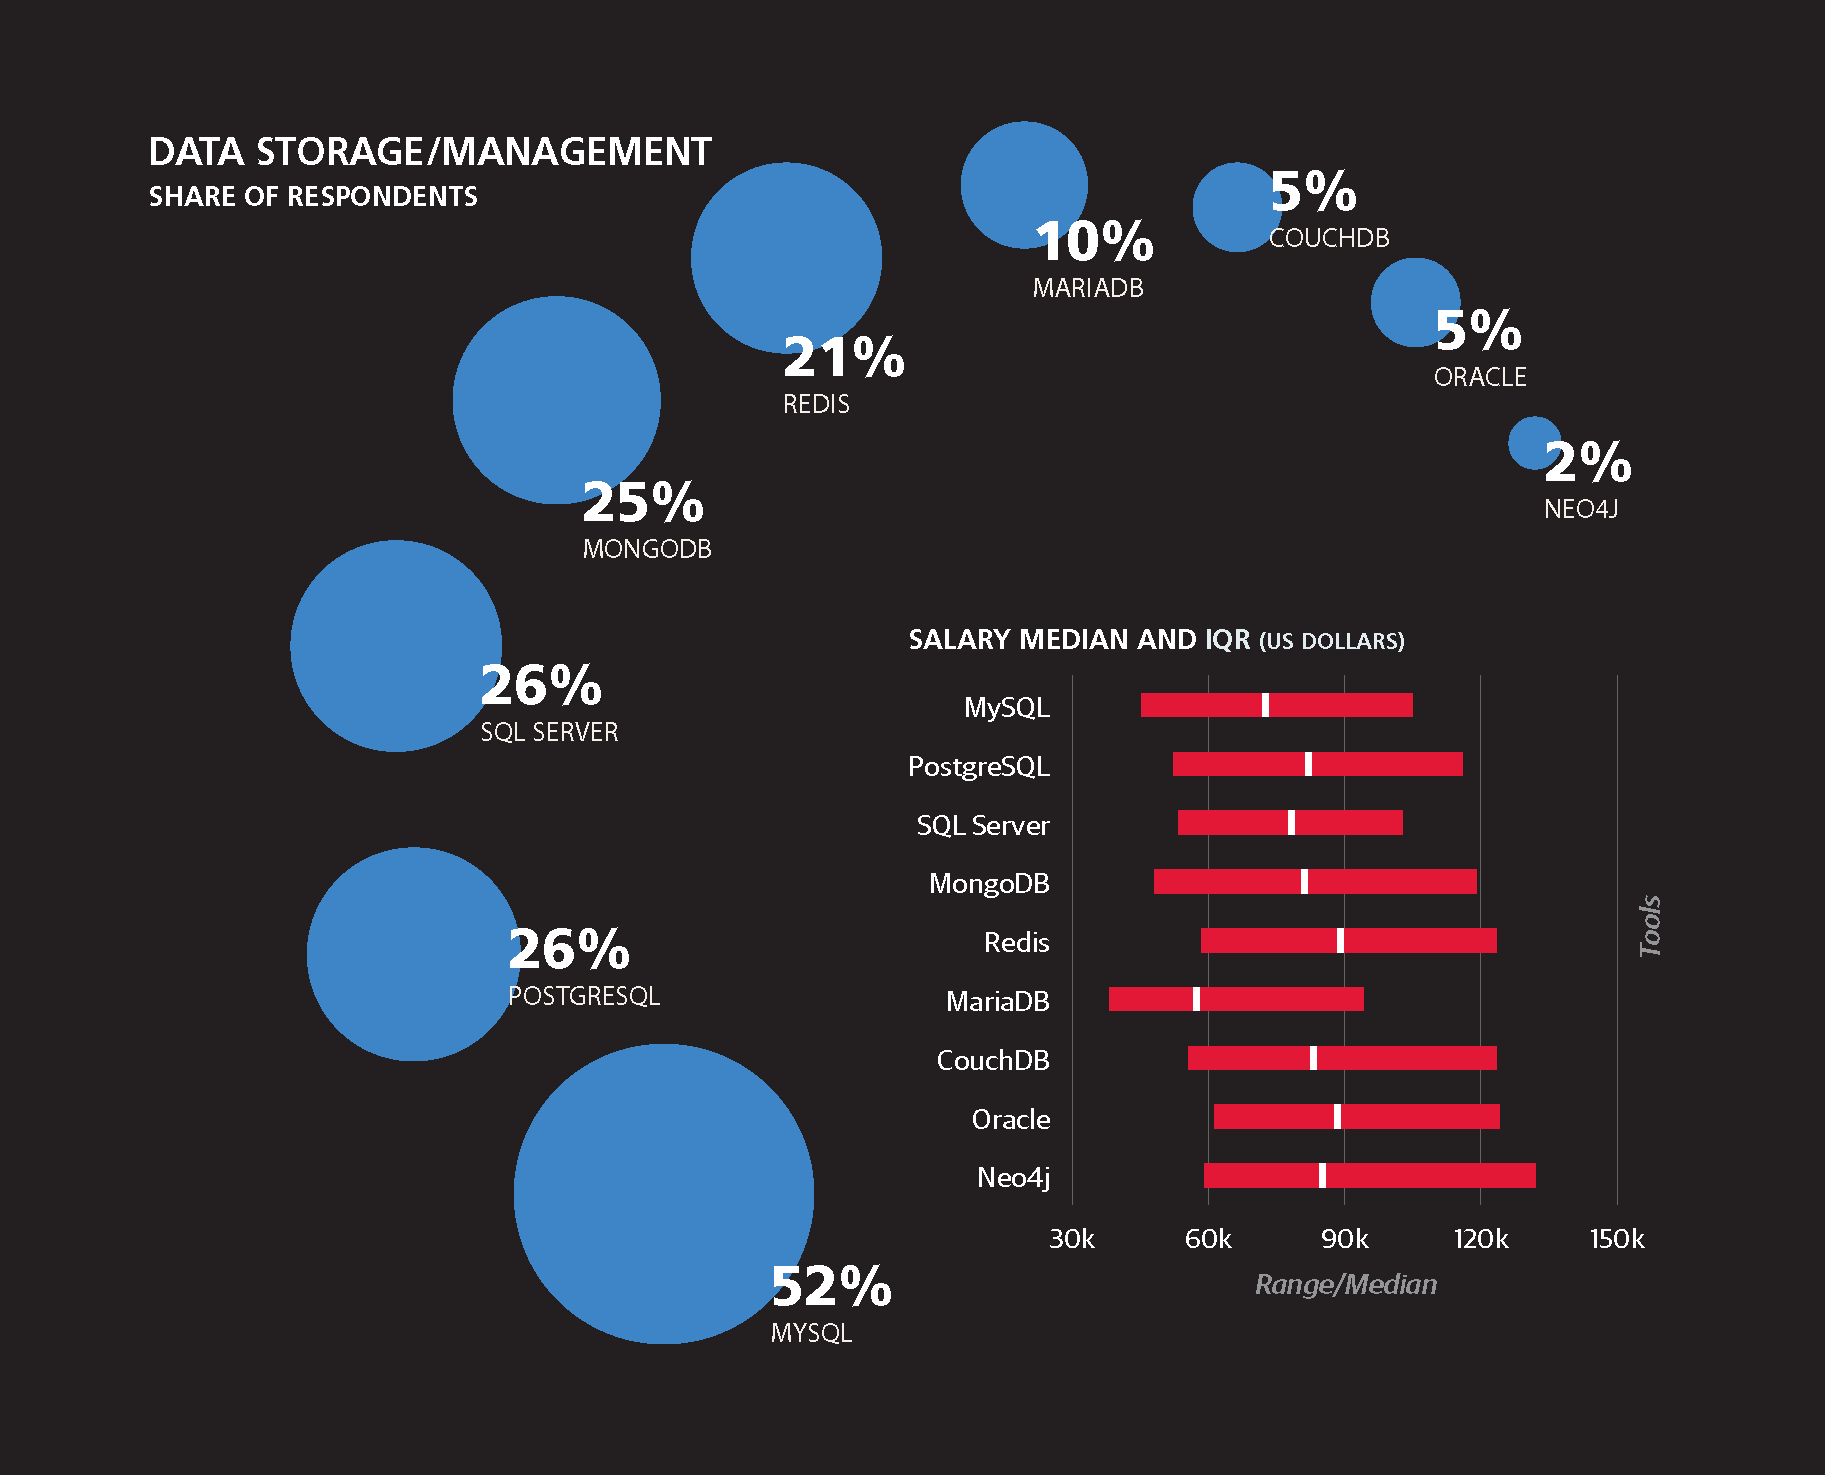
MySQL remains the dominant database behind the
web, at 52%. MariaDB, at 9%, has failed to make
great inroads among MySQL fans, at least on the web.
PostgreSQL and SQL Server come up next, both at 26%,
and a plethora of diverse solutions follow:-
MongoDB: 25%
-
Redis: 21%
-
CouchDB: 5%
-
Oracle: 5%
-
Neo4j: 2%
-
-
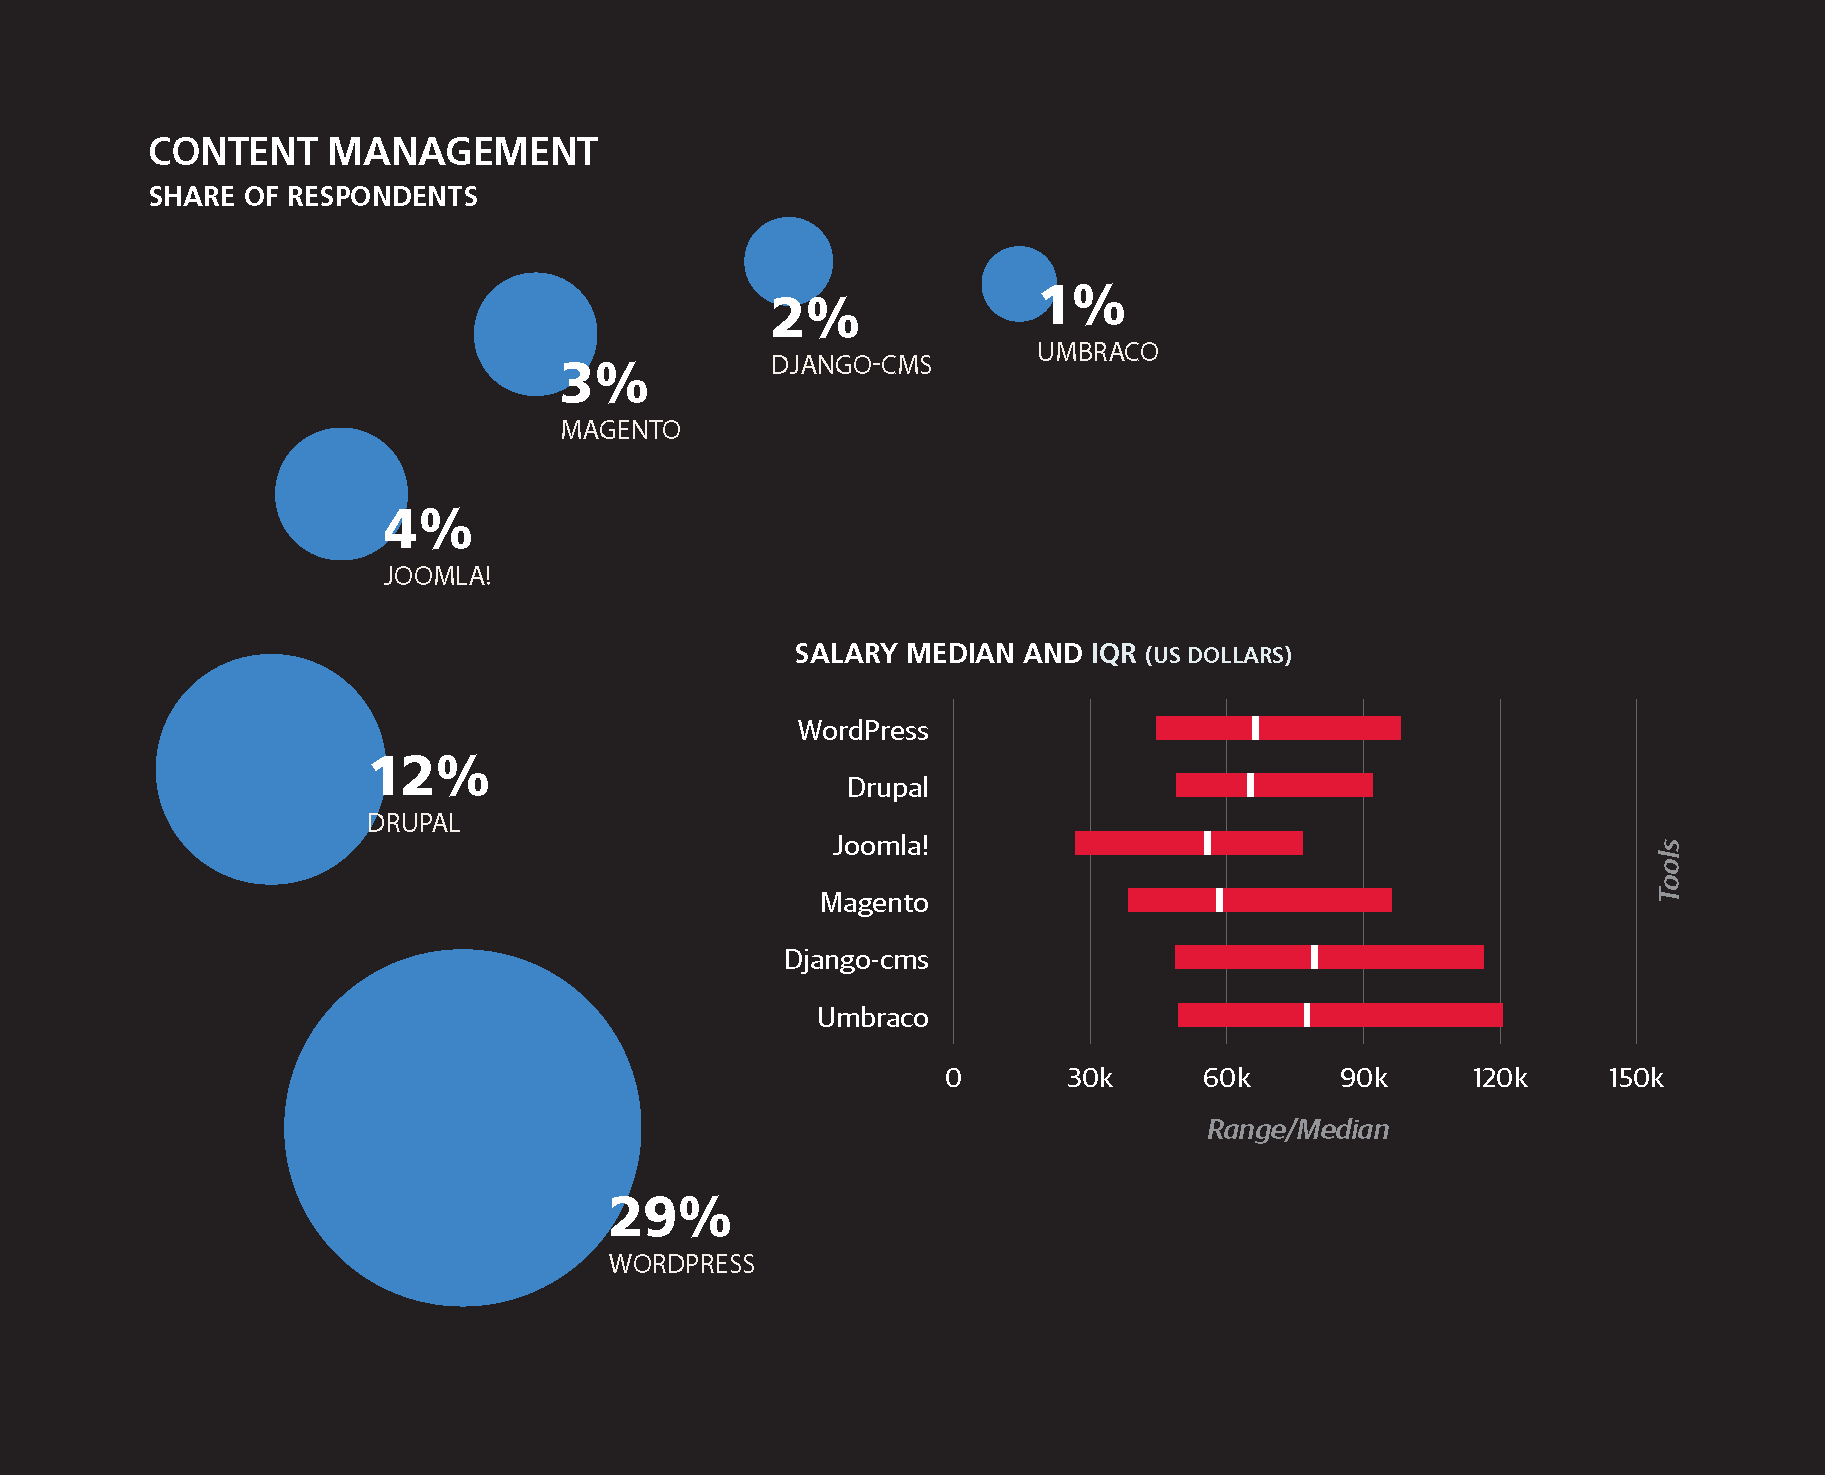
WordPress is the most popular CMS, although Drupal
makes a respectable showing:-
WordPress: 29%
-
Drupal: 12%
-
Joomla!: 4%
-
Magento: 4%
-
Django-cms: 2%
-
Umbraco: 1%
-
In general, working with libraries or frameworks led to a salary
$1,248 more than average.
Because there are so many tools, libraries, and frameworks,
we applied some basic machine learning to find clusters of
related tools. The principle is that people who use one tool
are much more likely to use certain other tools as well. For
instance, Windows programmers tend to use ASP.NET for
their main framework, Visual Studio as their IDE, and SQL
Server for their database. Although one would expect to see
that cluster, we found nine other clusters that are much less
predictable. We’ll look at each in this section, along with their
positive or negative effects on salary.
There are two reasons you will find these clusters interesting:
-
If you want to get a higher salary, you might be able to
do so by learning a cluster that has a positive impact (or
less of a negative impact) on salary. -
If you like where you are, you might broaden your skills by
learning new tools or frameworks that are clustered with
the ones you already know.
Many of the most popular tools and frameworks among
our respondents turn up in none of the ten clusters. This is
probably because they are so pervasive (jQuery, for instance)
that they are used by a wide range of programmers across
multiple clusters.
Express Cluster
The first cluster surrounds the popular Express framework.
It is the most lucrative cluster we found because each tool
in it adds an average of $2,068 to salaries. (We found this
to be true up to a maximum of eight tools in this cluster—if
you keep adding tools, your salary tops out after eight). The
cluster includes:
-
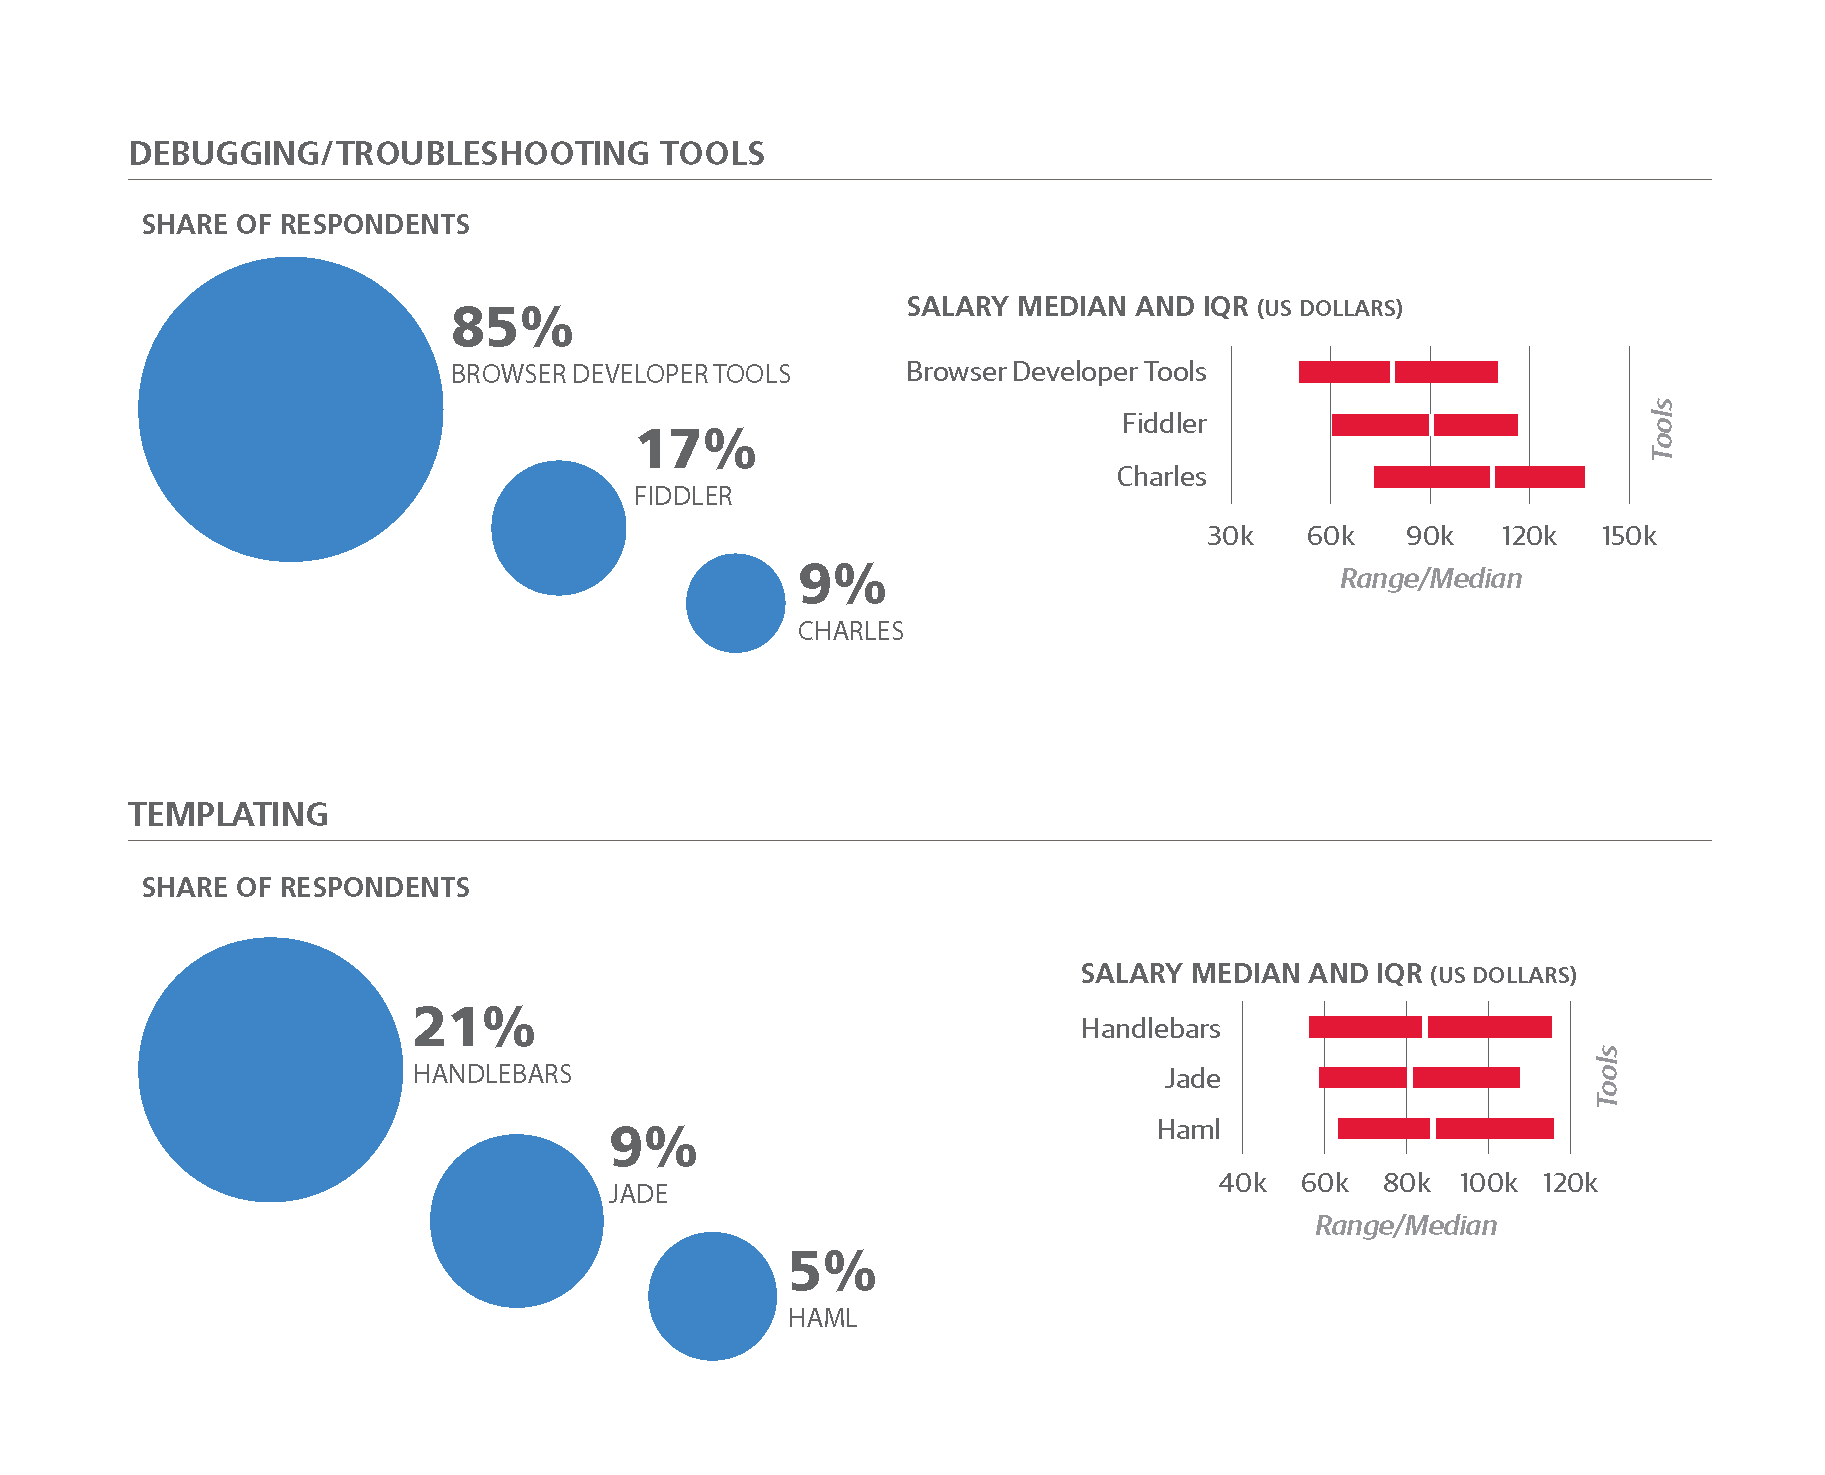
Charles debugger
-
Express framework
-
Jade
templating framework -
Mocha test framework
-
MongoDB data
storage engine -
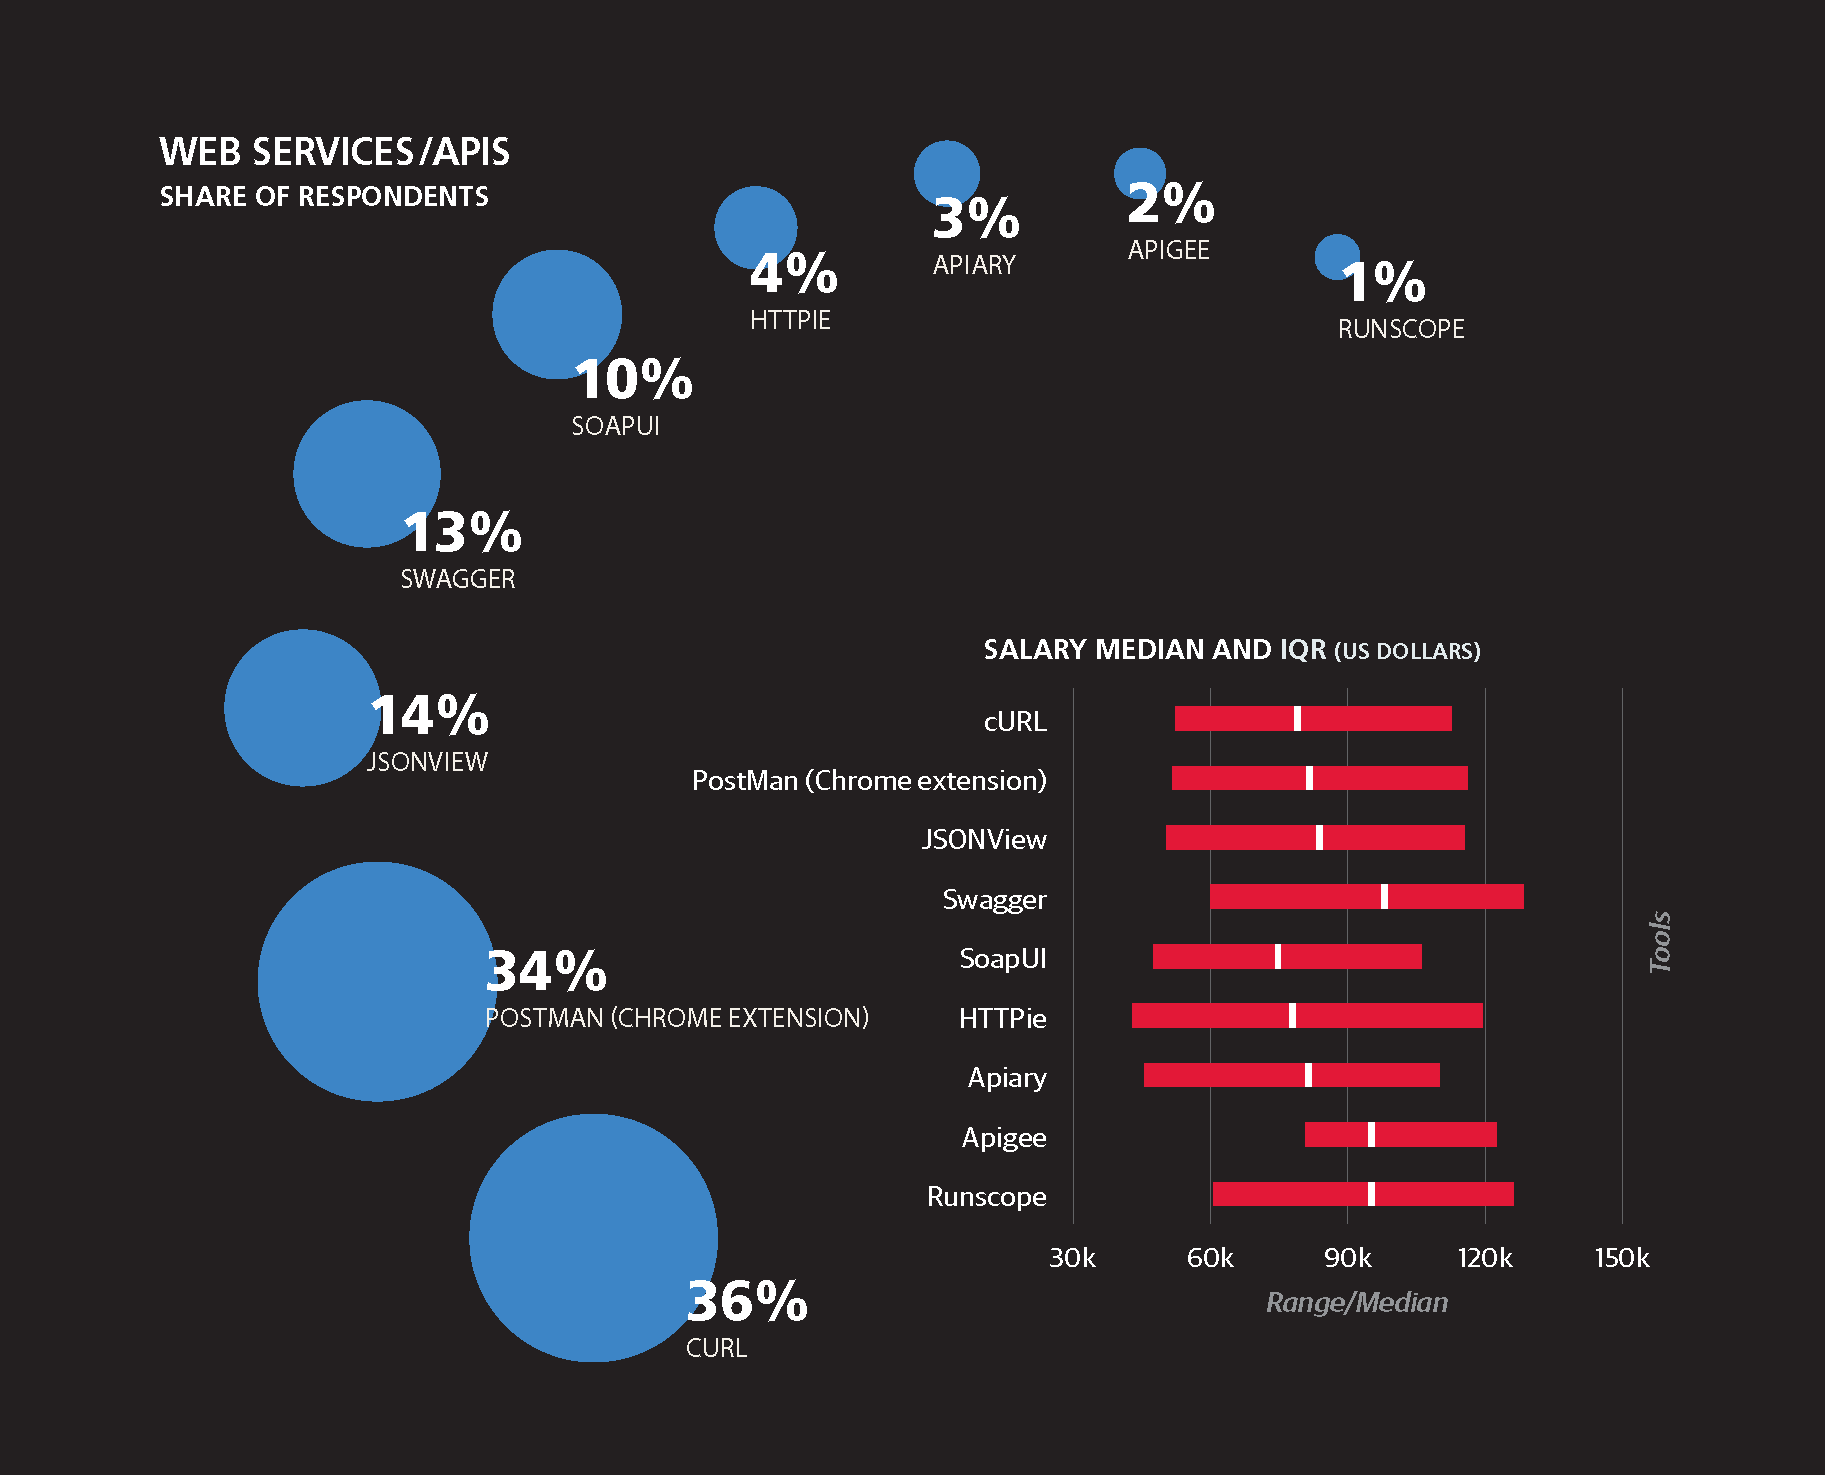
PostMan
Chrome extension -
React framework
-
Swagger web framework
-
Webpack module bundler
It is hard to see a rationale for using these particular tools
together. React is a fairly popular framework in its own
right, but other tools, such as Jade, are used by relatively few
programmers. In any case, our statistics suggest they make a
good combo.
Ruby/PostgreSQL Cluster
This cluster includes many well-known tools, but none of
them are among the most popular in the survey. However,
they tend to be used together, and knowing each one adds
an average of $1,442 to salaries (up to a maximum of seven
tools):
-
Capistrano continuous integrator
-
Chef configuration manager
-
Haml templating framework
-
JSONView display tool
-
Jekyll continuous integrator
-
PostgreSQL database
-
Redis caching server
-
Ruby language
-
Travis CI continuous integrator
It would make sense for Ruby programmers to rely on
Capistrano, which was designed for Ruby. Haml is also Ruby-oriented, with a Ruby on Rails plug-in. Most of the other
tools are language agnostic and don’t have obvious interconnections.
And as already mentioned, none are among the
most popular tools among our respondents.
Free Software Cluster
The tools in this cluster are mostly familiar and are generally
used together. Our respondents chose Vim (29%) much less
than Sublime (42%) but more than Emacs (5%). The Perl
language is used by only 5% of respondents but turned up
in this cluster along with Python (22%). This cluster has no
effect on average salary.
-
Bash shell command line
-
cURL downloader
-
GitLab source
code repository -
Linux operating system
-
Perl language
-
Python language
-
Unix operating system
-
Vim text editor
GitHub Cluster
In contrast to the previous cluster, which tended to use
GitLab, the far more popular GitHub has its own cluster.
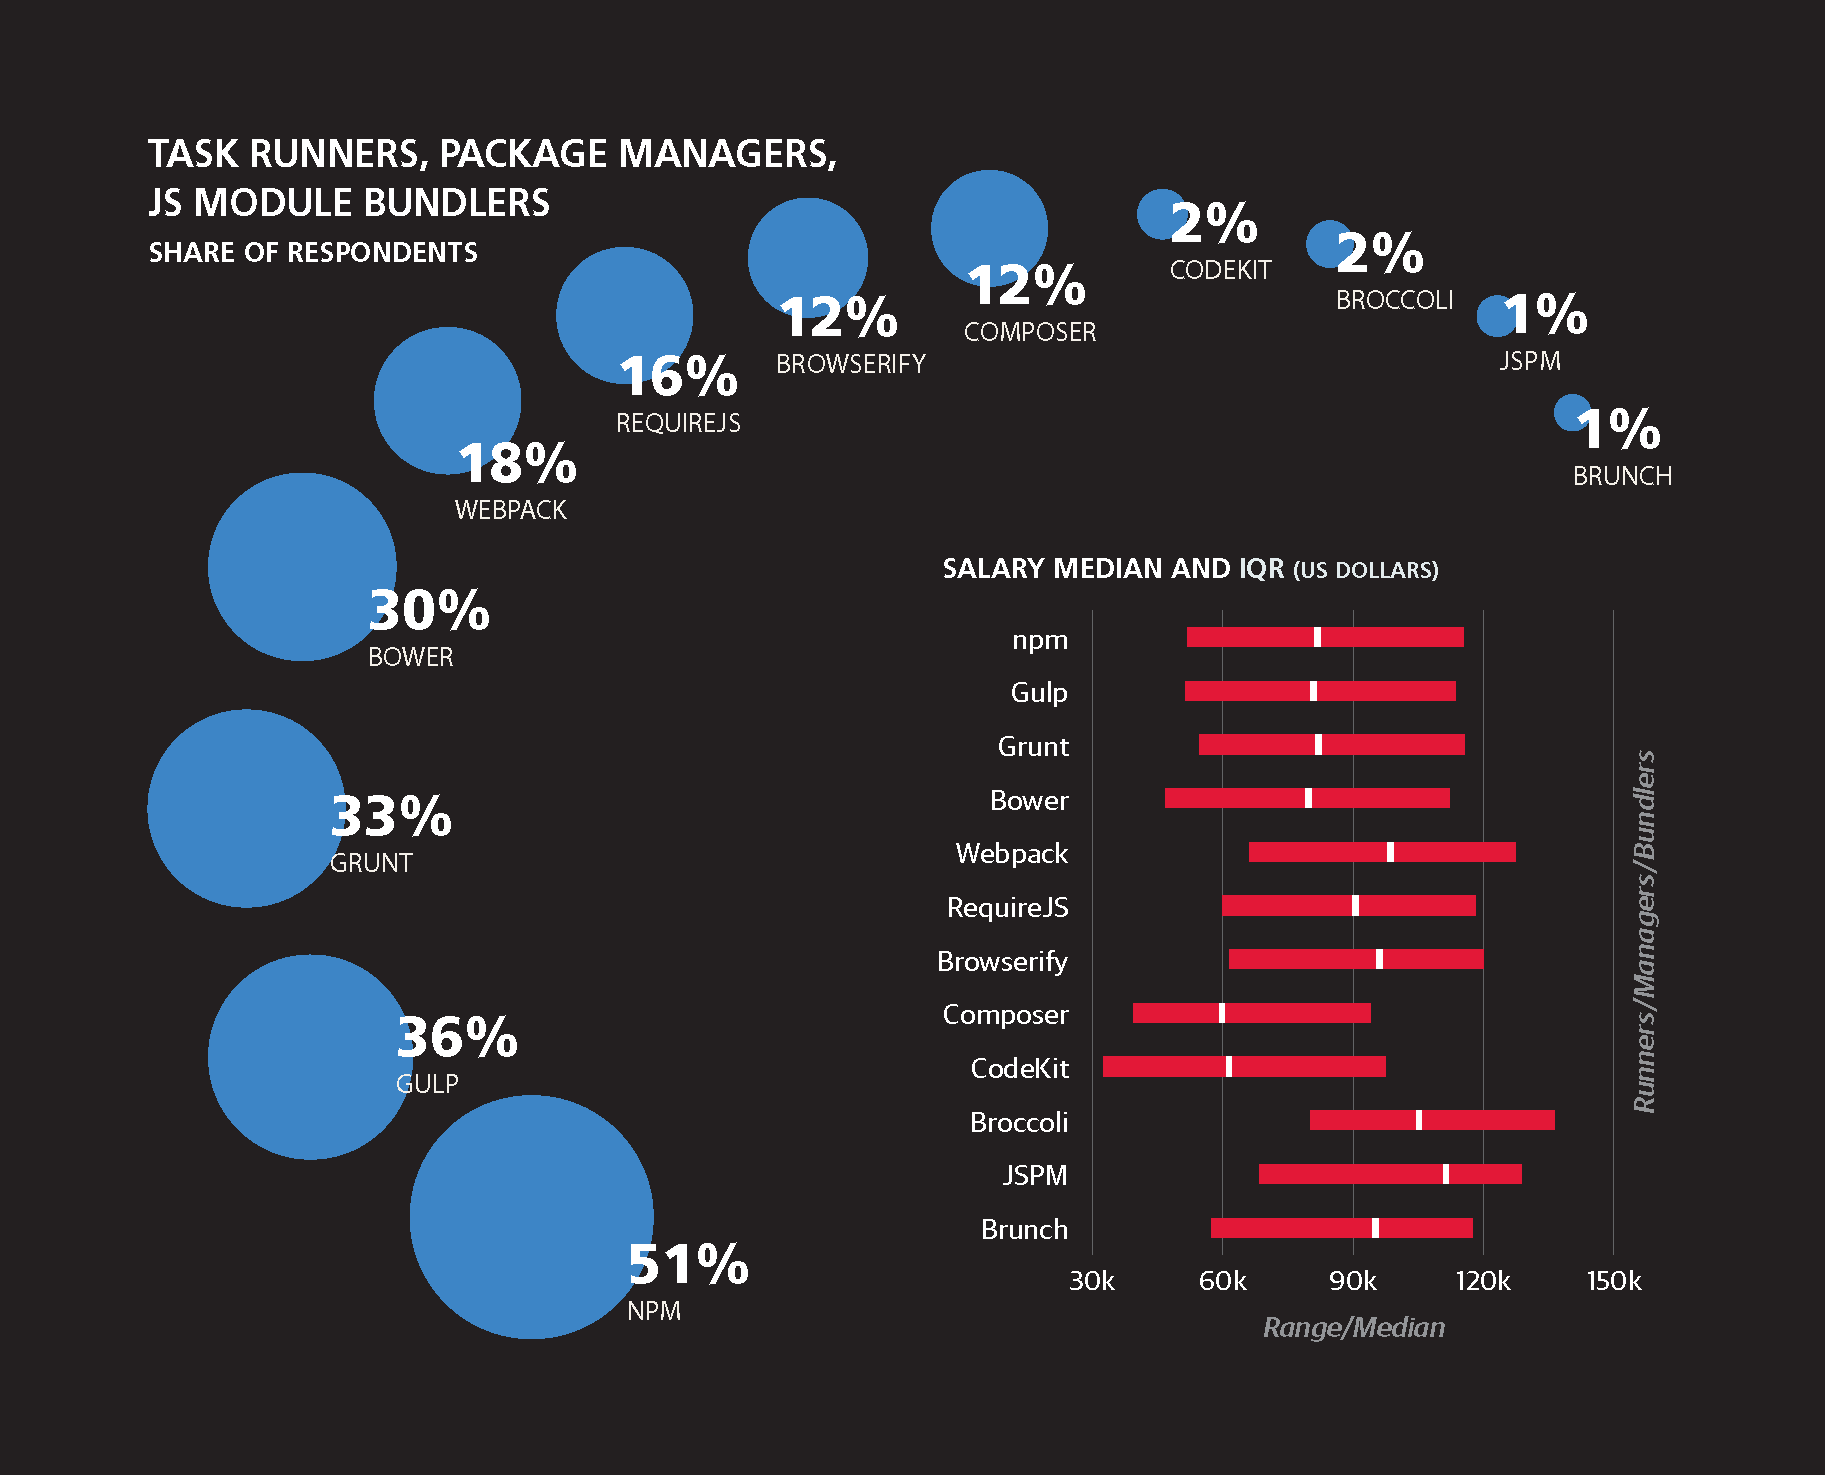
npm, another tool in this cluster, was the most popular in its
category, used by 51% of respondents. But the cluster has no
effect on average salary.
-
Atom text editor
-
Backbone
JavaScript framework -
Bitbucket version control
-
Bower package manager
-
Browserify
package manager -
Grunt task manager
-
Gulp task manager
-
Handlebars
templating framework -
npm package manager
-
RequireJS
package manager
The connections among these tools make sense. Most are tied
in with Node.js, and many depend on npm.
Graphics Cluster
The relationship among these tools is obvious. They are used
for designing, creating, and testing user interfaces. This cluster
has no effect on average salary.
-
Canvas graphics engine
-
D3 graphics library
-
Sketch user interface
design tool -
SVG graphics engine
-
WebGL graphics API
-
WebPagetest
performance tool
Established Tool Cluster
We have tried to choose a neutral name for this cluster, but
to many readers, it may smack of “legacy” tools. One can
well wonder where Subversion users have been hiding during
the past decade’s move to distributed version control, but
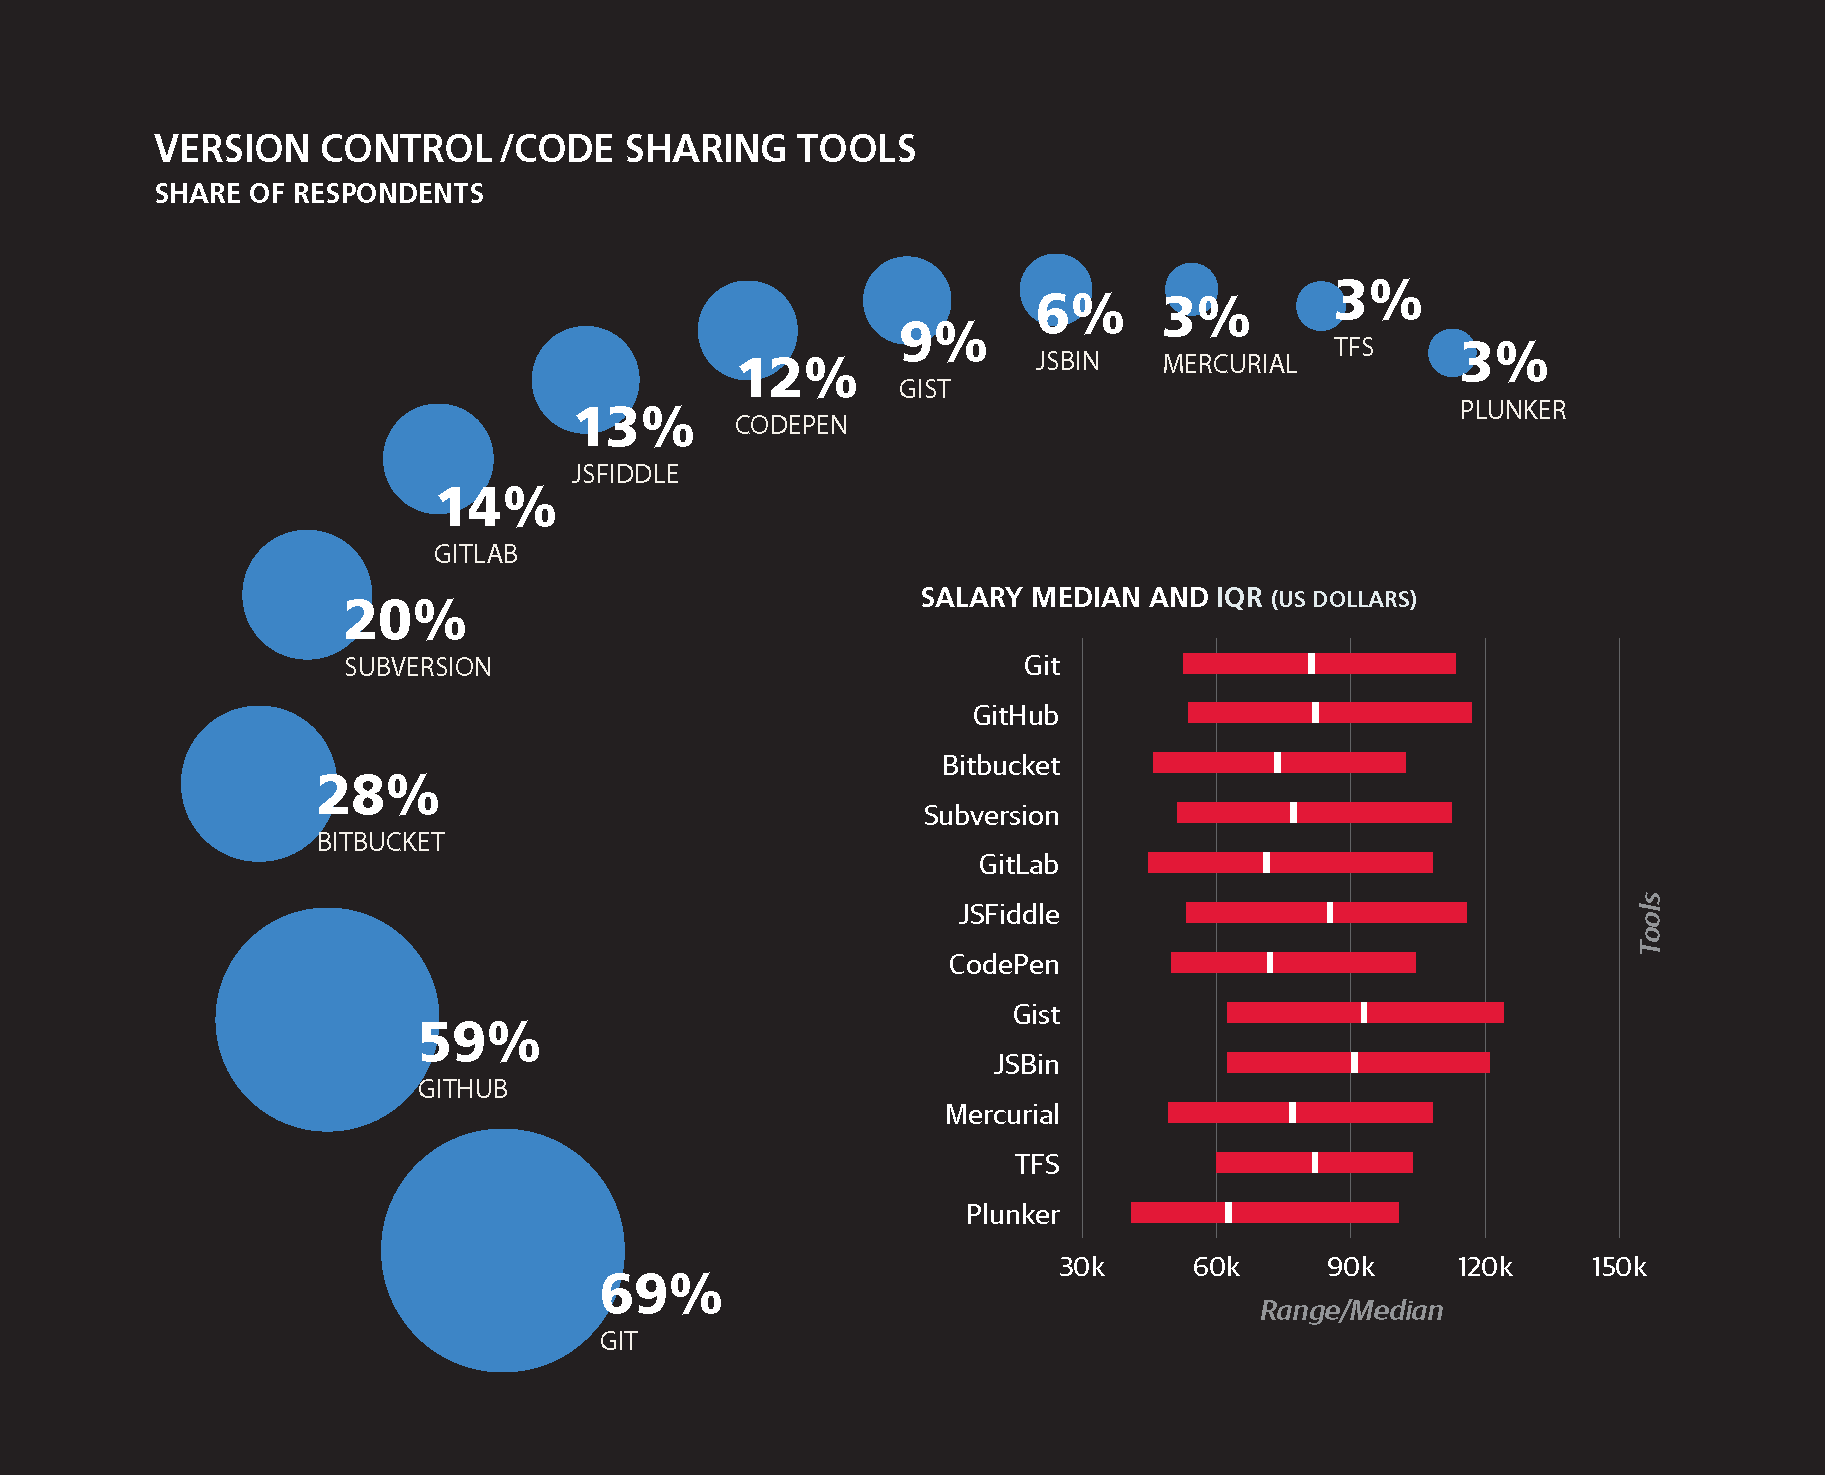
Subversion still holds the allegiance of 20% of our respondents
(more than GitLab at 14%, or Mercurial at a mere 3%).
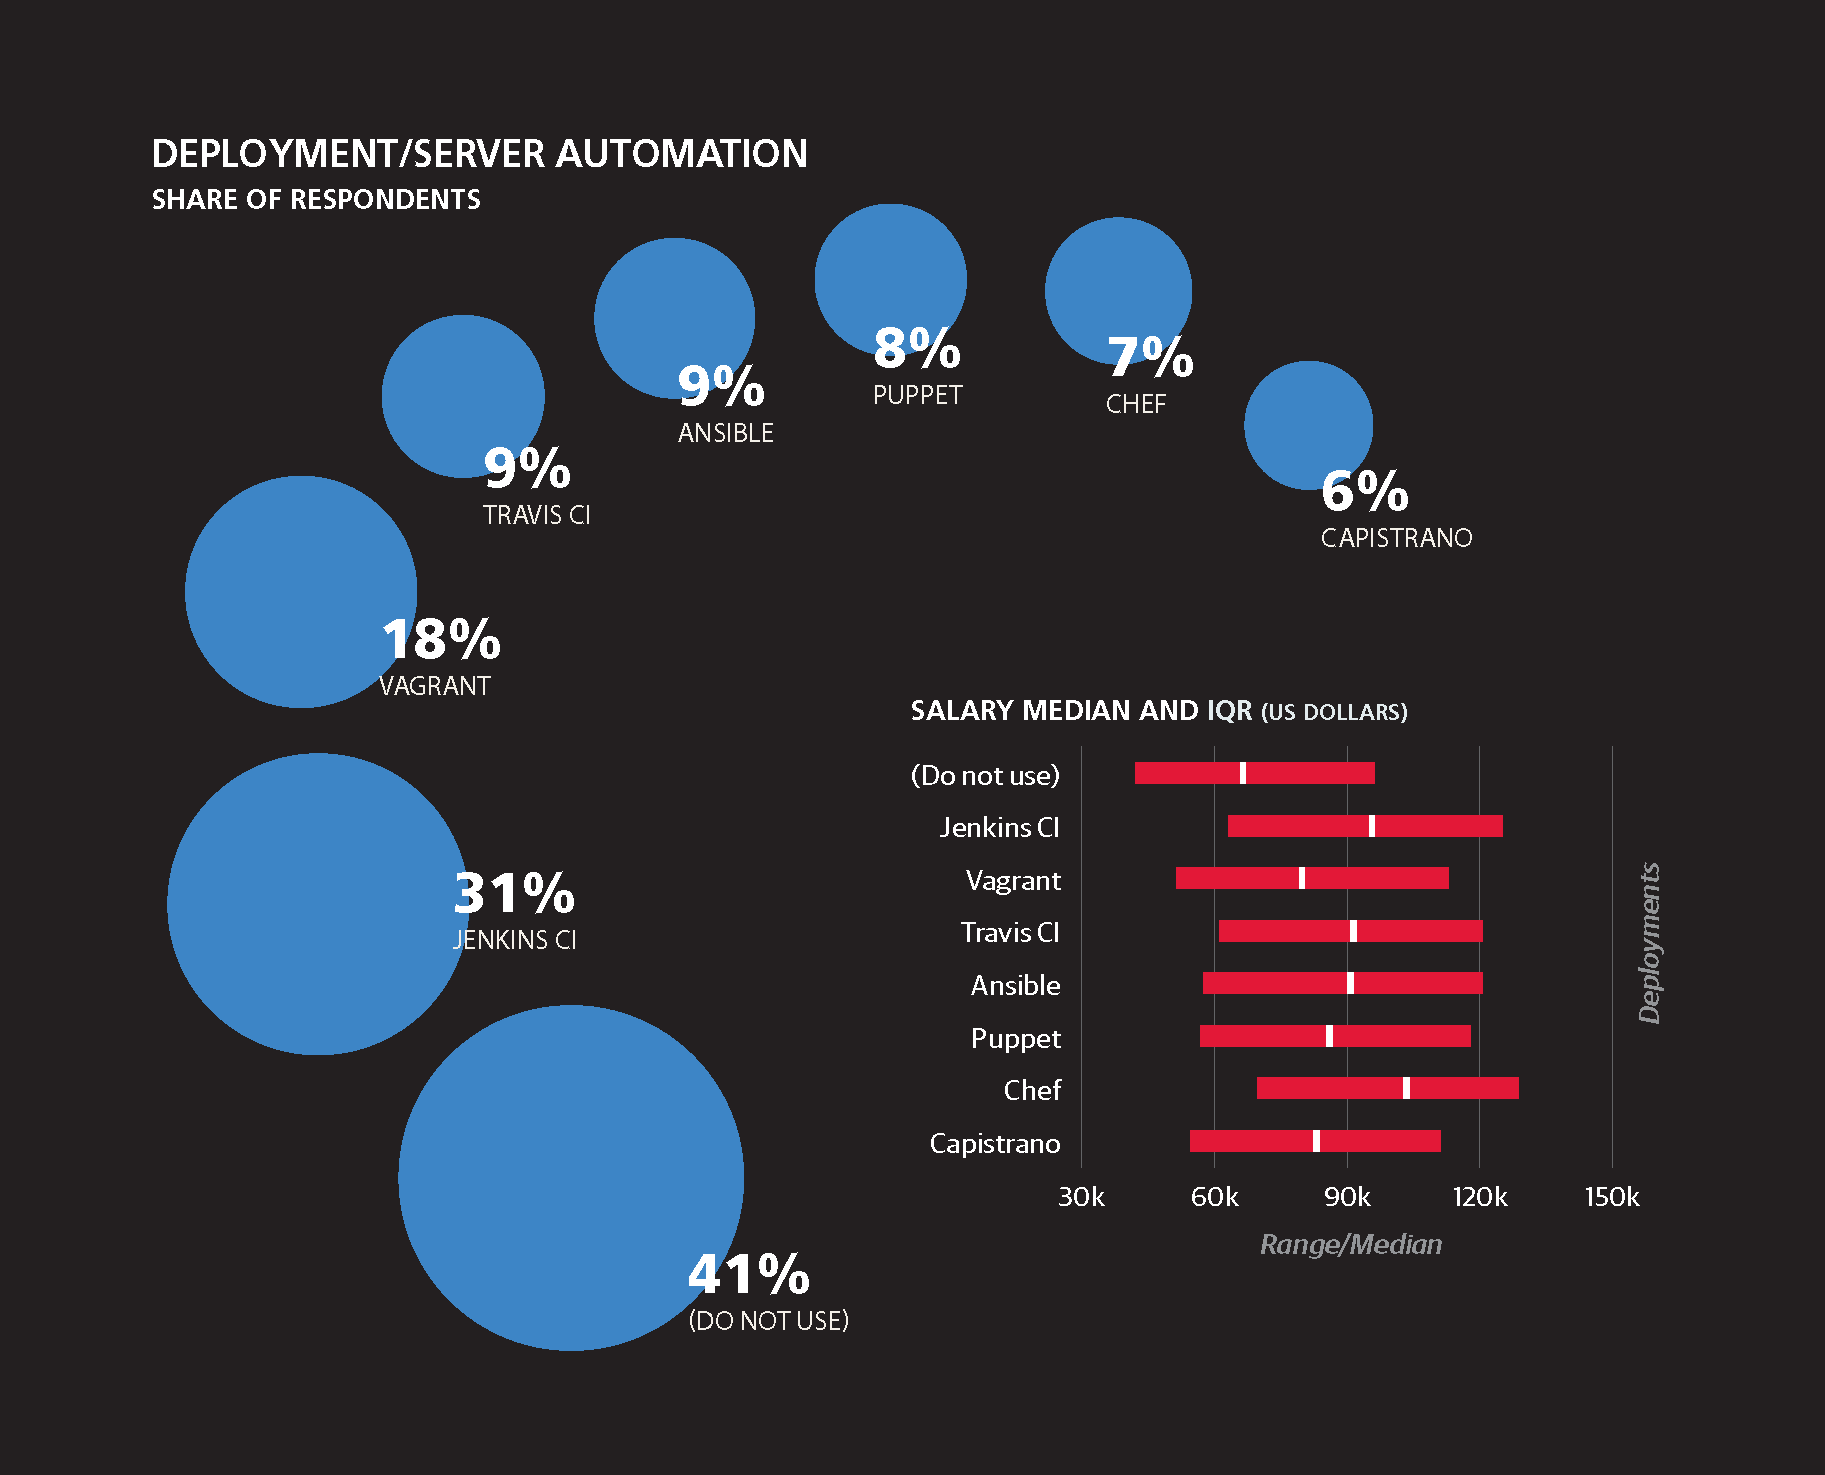
There is no doubt that C++ and Java remain critical parts of
the computing infrastructure, although most web developers
have abandoned them for slicker and newer languages (and
39% of respondents use PHP as well). Oracle is also going
strong. Still, among our respondents, Jenkins CI is the only
tool in the following cluster that appears at the top of their
choices (31%).
This cluster has no effect on average salary.
-
C/C++ language
-
Eclipse integrated development environment
-
JMeter performance tool
-
Java language
-
Jenkins CI continuous integrator
-
JetBrains IDE integrated development environment
-
Oracle database
-
SoapUI functional test tool
-
Subversion version control system
Test Cluster
Several tools and frameworks for testing appear in this cluster,
some of them very popular and some of them used by only a
few people. Other tools appear here too, for unclear reasons.
This cluster has no effect on average salary.
-
Angular JavaScript framework
-
Jasmine test framework
-
Karma test runner
-
LESS database modeling tool
-
Protractor test framework
-
Selenium test framework
-
WebStorm integrated development environment
Code Development Cluster
The tools and websites in this cluster help JavaScript developers
learn, share, and develop code in various ways. Some of
the tools may be more popular among newer programmers,
although they have broad value. This cluster has no effect on
average salary.
-
Brackets text editor
-
CodePen code repository
-
Gist code sharing tool
-
JSBin code repository
-
JSFiddle text editor
-
Sublime text editor
Windows Cluster
Most of the tools in this cluster work only in a Windows environment.
None are popular across our respondents overall,
but they clearly form an important subculture. However, using
each tool in this cluster is shown by our analysis to reduce
average salary by $1,129.
-
ASP/ASP.NET framework
-
Fiddler debugger
-
Knockout JavaScript framework
-
Notepad++ editor
-
SQL Server database
-
Visual Studio Code text editor
-
Visual Studio integrated development environment
-
Windows operating system
LAMP Cluster
Most of the tools in this cluster are part of the classic web
stack of Linux, Apache, MySQL, and PHP. Composer is a
PHP package manager. We don’t know why Photoshop and
WordPress turn up here. In any case, these tools impose a
penalty, despite their popularity: each one (up to a maximum
of seven) decreases average salary by $2,257.
-
Adobe Photoshop graphic
manipulation program -
CodeIgniter
PHP framework -
Composer
package manager -
Drupal content
management system -
Laravel PHP framework
-
MariaDB database
-
MySQL database
-
PHP language
-
Symfony PHP framework
-
WordPress content
management system -
Zend Framework
PHP framework
