How Twitter monitors millions of time series
A distributed, near real-time system simplifies the collection, storage, and mining of massive amounts of event data
 North American detail map of Flickr and Twitter locations. (source: Eric Fischer on Flickr)
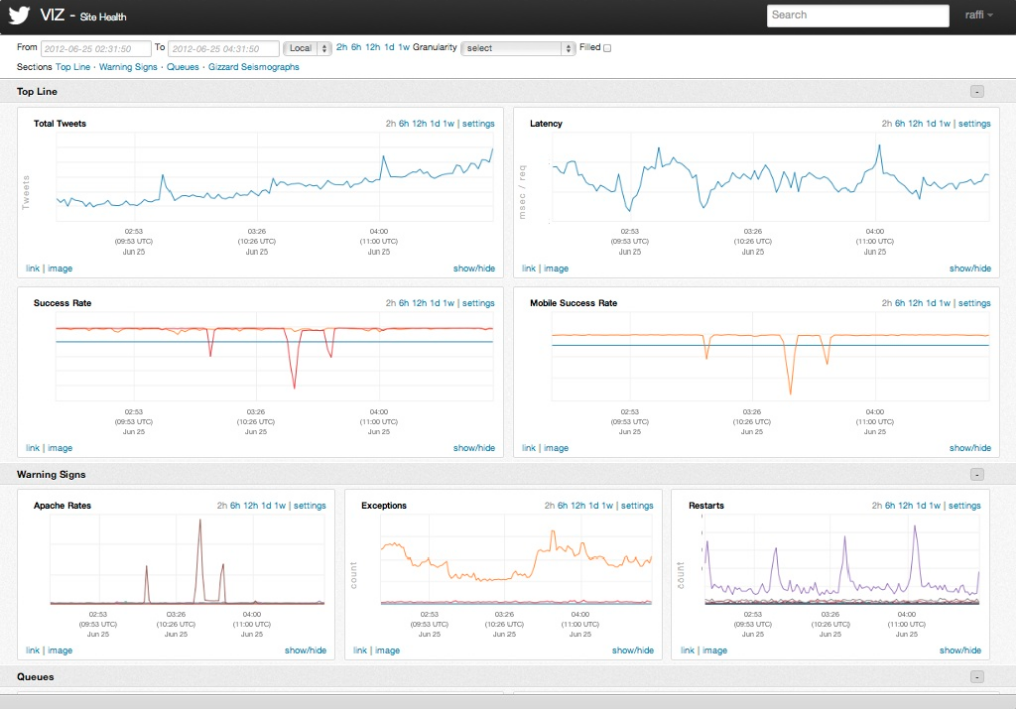
One of the keys to Twitter’s ability to process 500 millions tweets daily is a software development process that values monitoring and measurement. A recent post from the company’s Observability team detailed the software stack for monitoring the performance characteristics of software services, and alert teams when problems occur. The Observability stack collects 170 million individual metrics (time series) every minute and serves up 200 million queries per day. Simple query tools are used to populate charts and dashboards (a typical user monitors about 47 charts).
The stack is about three years old1 and consists of instrumentation2 (data collection primarily via Finagle), storage (Apache Cassandra), a query language and execution engine3, visualization4, and basic analytics. Four distinct Cassandra clusters are used to serve different requirements (real-time, historical, aggregate, index). A lot of engineering work went into making these tools as simple to use as possible. The end result is that these different pieces provide a flexible and interactive framework for developers: insert a few lines of (instrumentation) code and start viewing charts within minutes5.

The Observability stack’s suite of analytic functions is a work in progress – only simple tools are currently available. Potential anomalies are highlighted visually and users can input simple alerts (“if the value exceeds 100 for 10 minutes, alert me”). While rule-based alerts are useful, they cannot proactively detect unexpected problems (or “unknown unknowns”). When faced with tracking a large number of time series, correlations are essential: if one time series signals an anomaly, it’s critical to know what others one should be worried about. In place of automatic correlation detection, for now Observability users leverage Zipkin (a distributed tracing system) to identify service dependencies. But its solid technical architecture should allow the Observability team to easily expand its analytic capabilities. Over the coming months, the team plans to add tools6 for pattern matching (search), and automatic correlation and anomaly detection.
While latency requirements tend to grab headlines (e.g. high frequency trading), Twitter’s Observability stack addresses a more common pain point: managing and mining many millions of time series. In an earlier post I noted that many interesting systems developed for monitoring IT Operations are beginning to tackle this problem. As self-tracking apps continue to proliferate, massively scalable backend systems for time series need to be built. So while I appreciate Twitter’s decision to open source Summingbird, I think just as many users will want to get their hands on an open source version of their Observability stack. I certainly hope the company decides to open source it in the near future.

Related posts:
